POC Science Director Notes: IOP 14
(Version 1)Curtis James, Jim Wilson, Rich Rotunno, and Andrea Buzzi
IOP-14: Convection Over the Ligurian Coast and Persistent Precipitation Over the Lago Maggiore Region2-4 November 1999
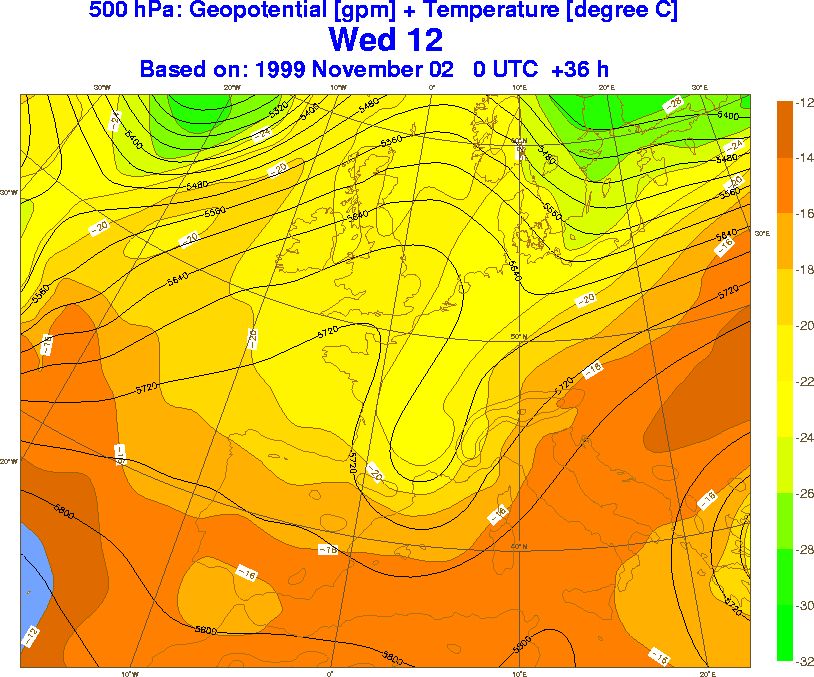
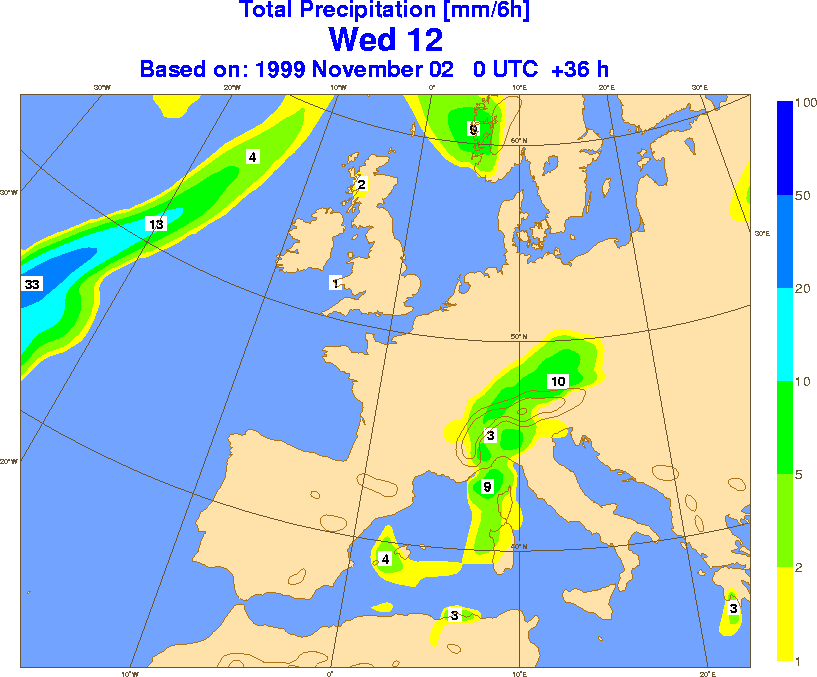
Tuesday 2 November: The ECMWF model indicated potentially heavy rain over the NW target area in association with a slow moving upper-level trough, becoming cutoff apparently due to an orographic cyclogenesis process (Fig. 1). Rain in the Lago Maggiore target area was predicted starting 3 November, but heavier 4 November (Fig. 2).
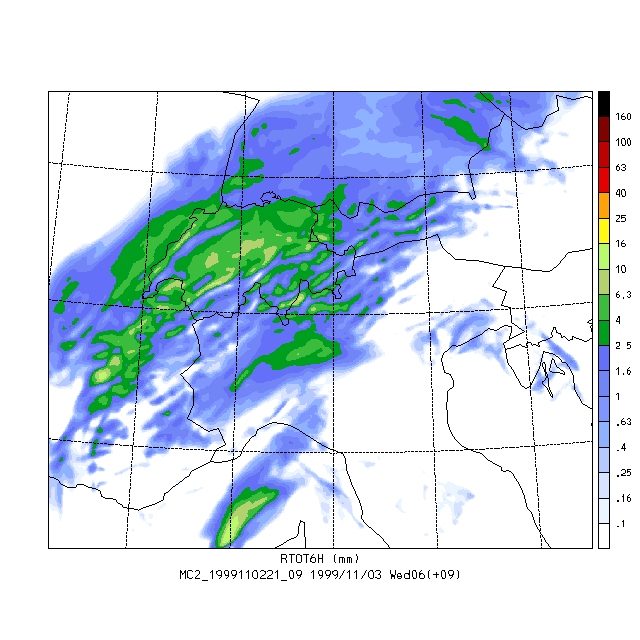
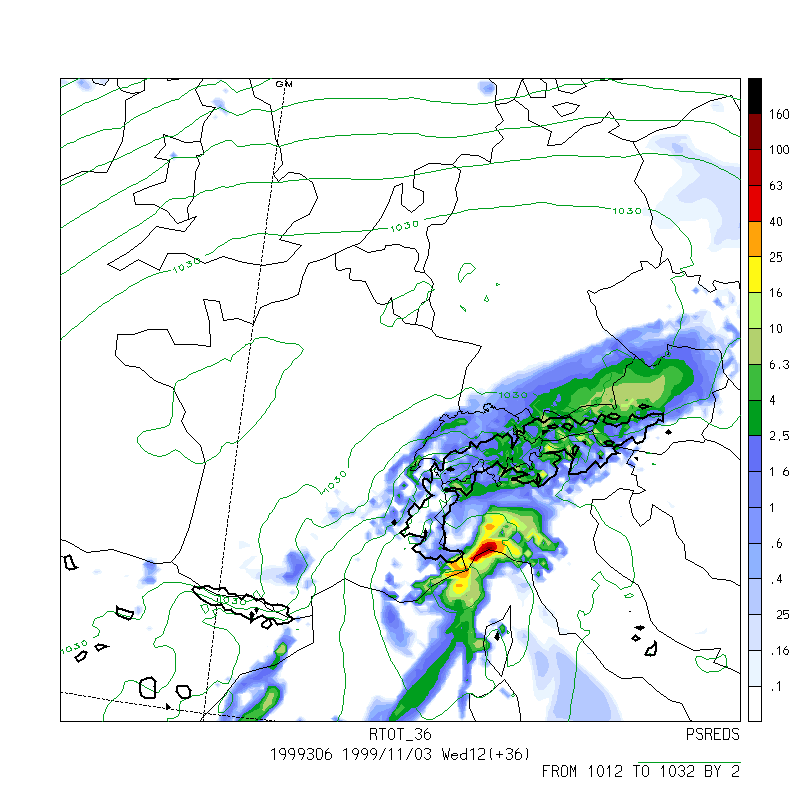
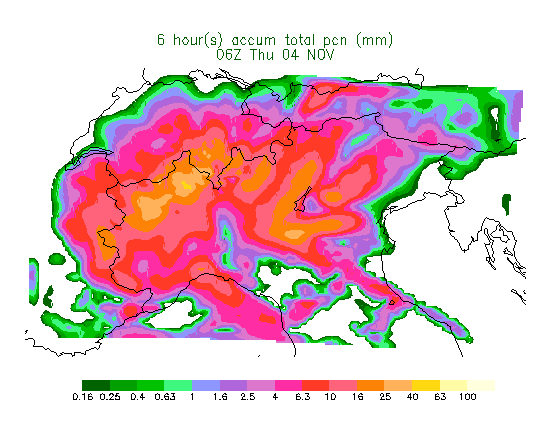
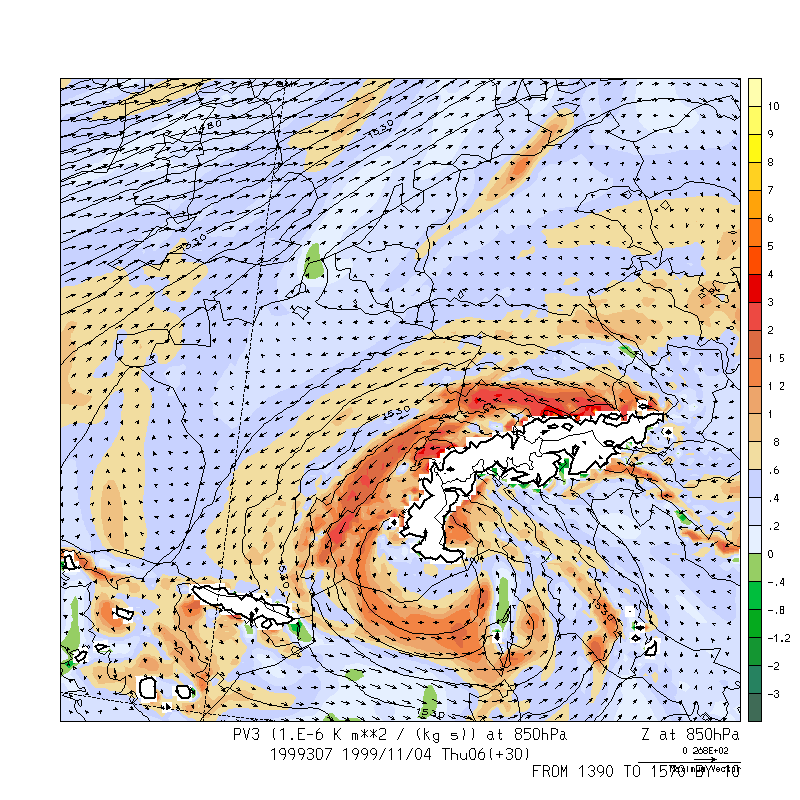
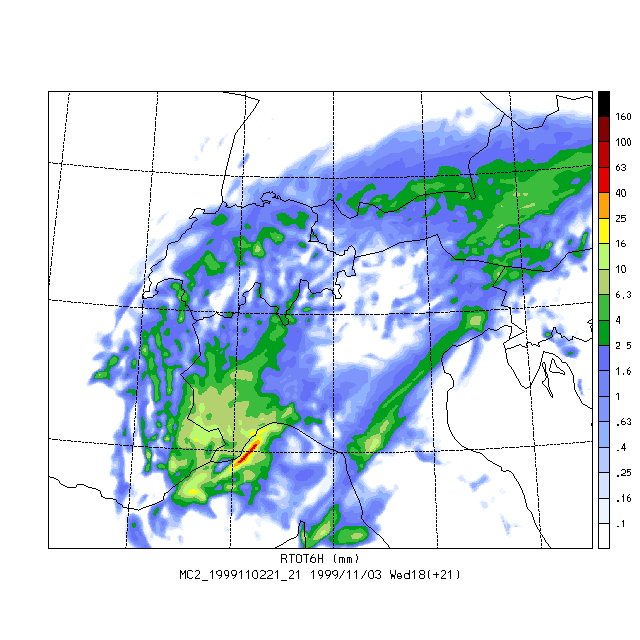
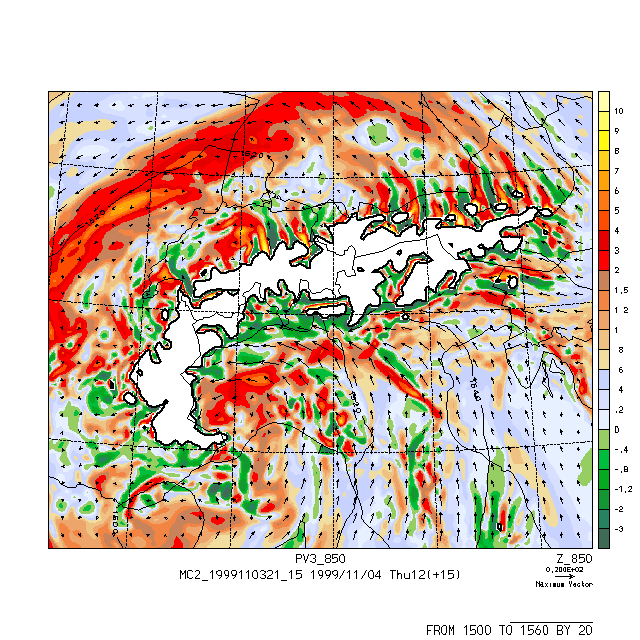
Wednesday 3 November: The MC2 run predicted somewhat weaker rain than indicated by SM the previous day (Fig. 3). The maxima were concentrated along the Ligurian coast, where the P3 and Electra planned to fly. Both the SM (Fig. 4) and the Bolam model (6.5 km res., Fig. 5) were predicting stronger precipitation in the target area on Thursday, mainly in the first part of the day over the Piedmont area and Liguria. Similar results were obtained by the MM5 (Fig. 6). As seen in previous cases, the rain in the western Po Valley was intimately connected to the cyclone centered over the Gulf of Genoa (Fig. 7).
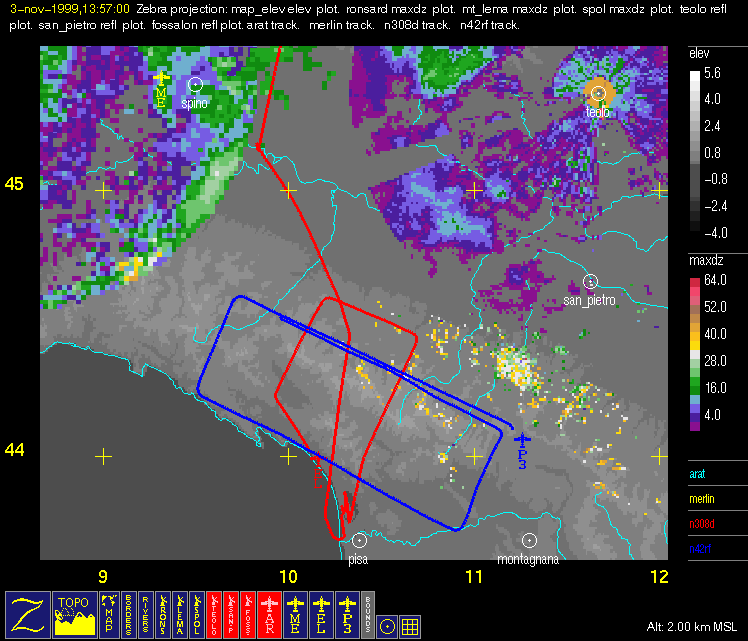
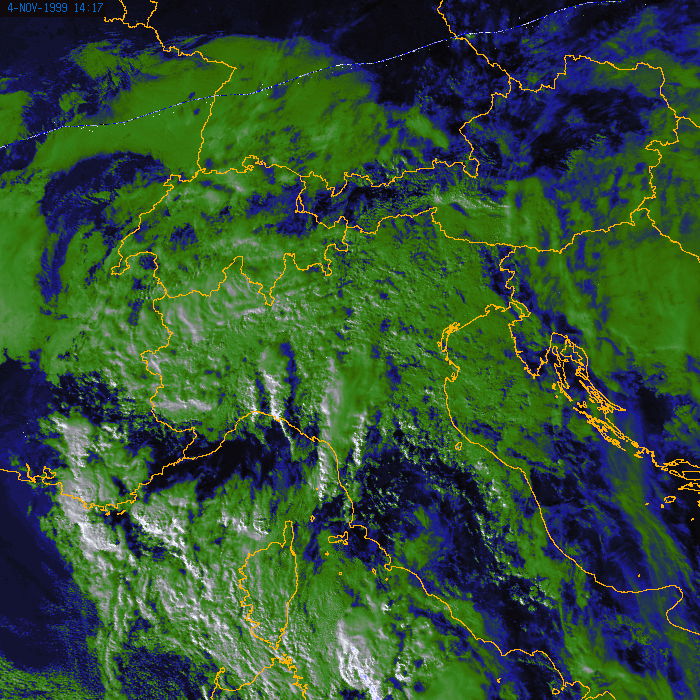
The French ARAT sampled the upstream flow over the Ligurian Sea, and the P3 and Electra flew a box pattern over the Ligurian coast (Fig. 8). Deep convection was observed in the area, as illustrated by the visible satellite image in Fig. 9. The P3 reported a lightning strike at about 1215 UTC at 43.75° N, 10.25° E. The Electra also reported lightning strikes, with damage to the nose cone and particle probes. Maximum reflectivities were 50-55 dBz.
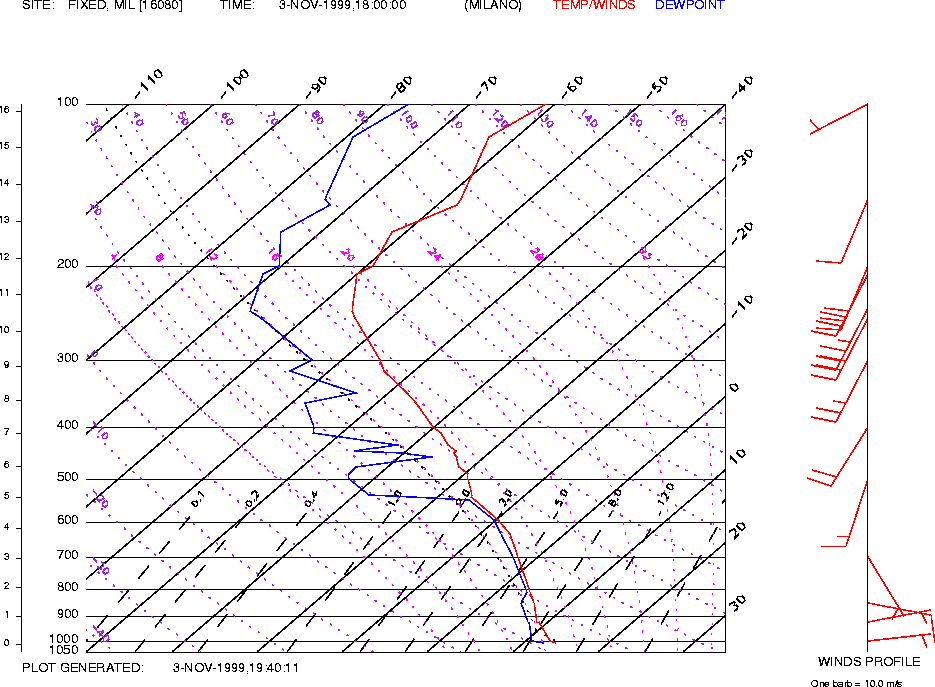
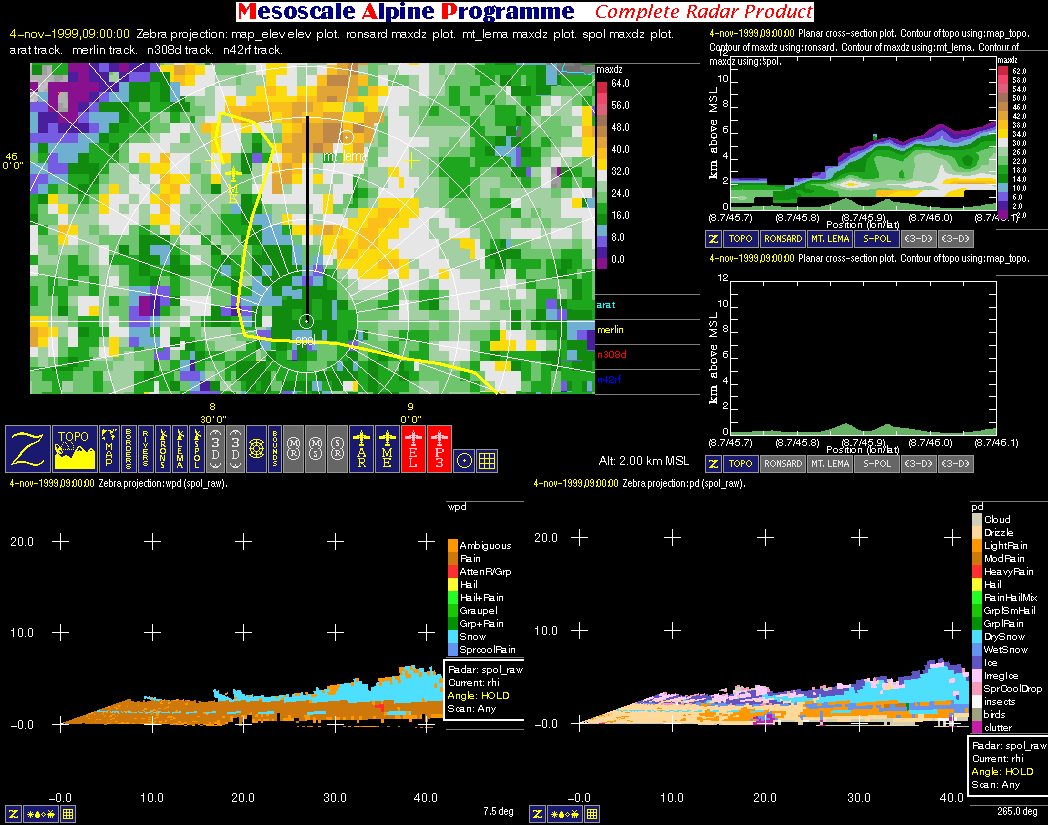
Over the dual-Doppler array, precipitation was light and widely scattered from the beginning of the day until about 1800 UTC. It then intensified, maximizing over the Lago Maggiore area and the Alpine foothills along the western Po Valley. The Milano sounding indicated that the static stability was close to neutral (Fig. 10), and shallow embedded convection was apparent throughout the night and into the following morning.
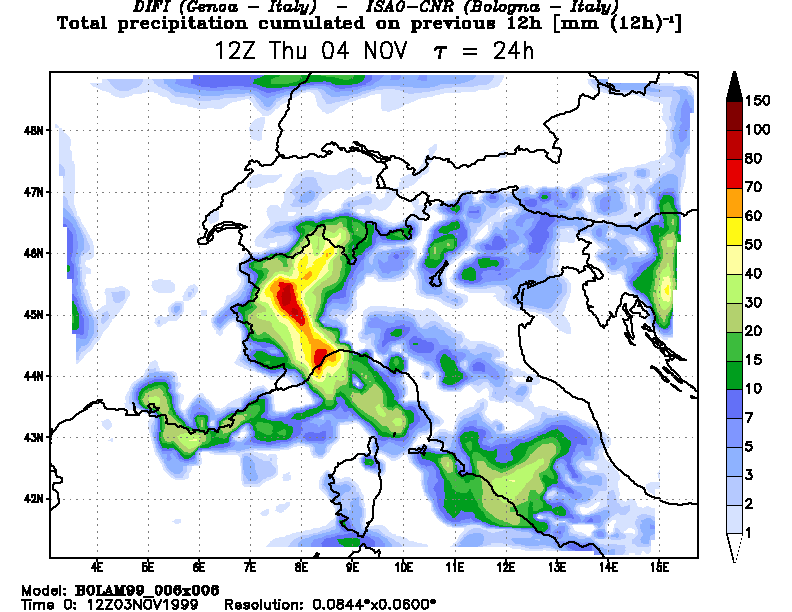
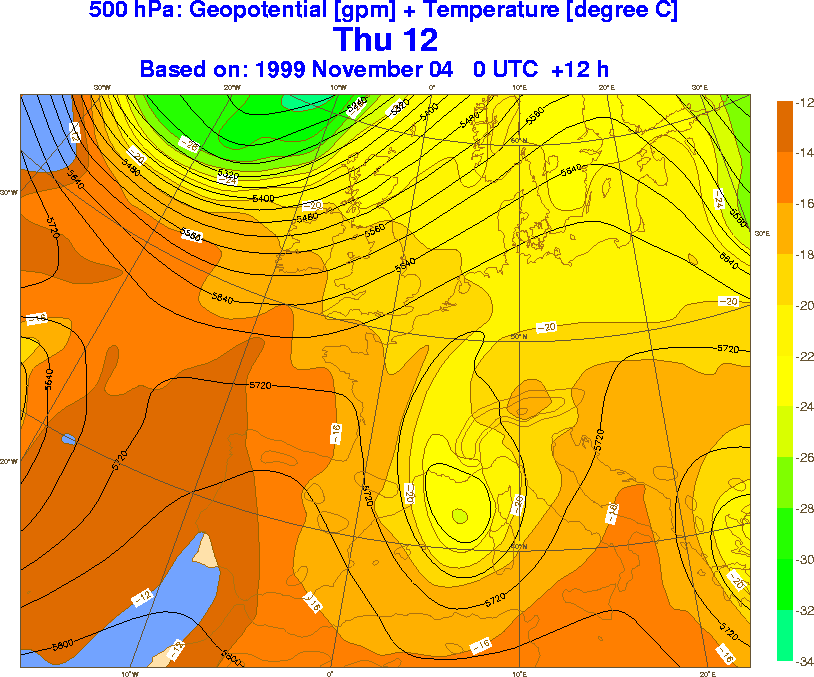
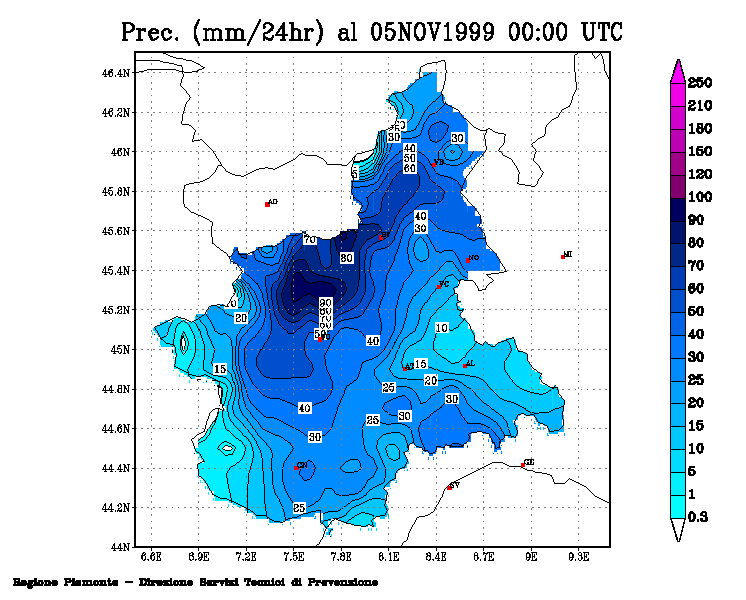
Thursday 4 November: The upper-level trough was favorably positioned to give rain over the target area (Fig. 11). The MC2 model (Fig. 12) reinforced the SM prediction of a circular arc of precipitation following cyclonic circulation over the Gulf of Genoa (Fig. 13). The actual precipitation in the 24 hour period over Piedmont Region (where a dense pluviometric network is available) is depicted in Fig. 14. The highest accumulated values, in excess of 90 mm/24 hours, were over the Alpine slope south of Valle d'Aosta. The shape of the maximum, elongated north from Liguria, then NE towards the Lago Maggiore, was well predicted by mesoscale models.
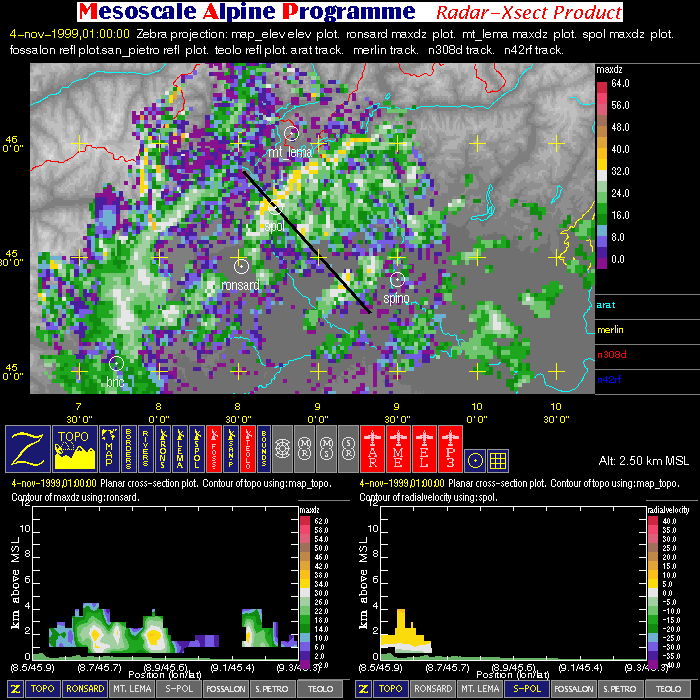
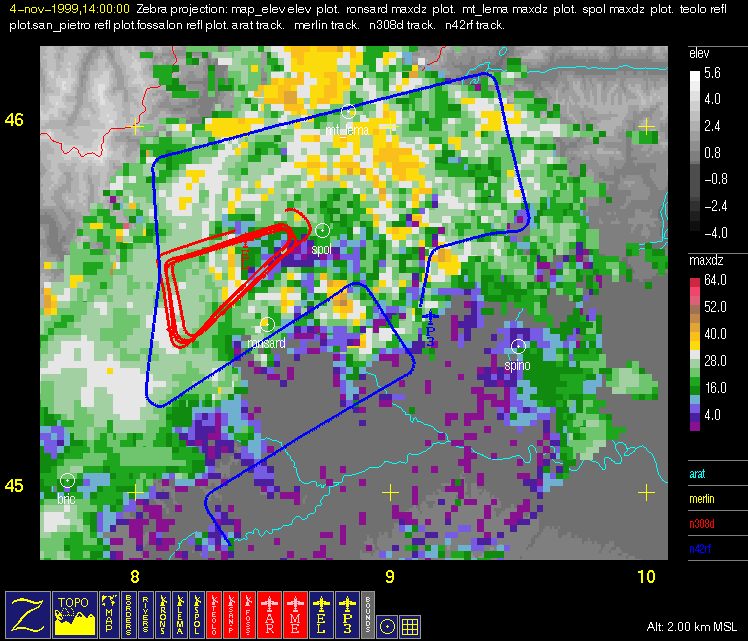
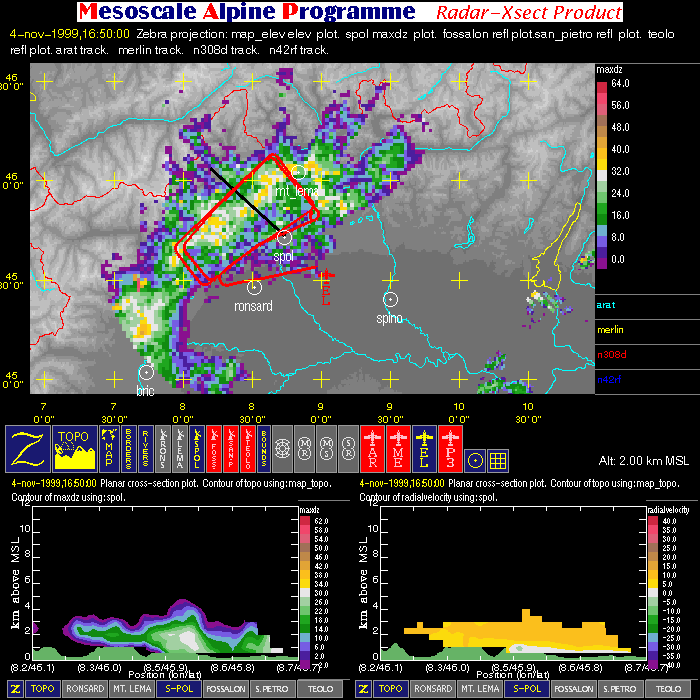
Many SW-NE orientated lines of precipitation formed throughout the period and moved through the region (Fig. 15). Most of the lines formed along the north and northwest edge of the Po valley moved northwestward and intensified as they moved into the foothills in the Lake Maggorie region. The precipitation could be characterized as stratiform with embedded cellular structure. Echo tops where generally low (6-8 km) with significant precipitation growth in the 2-3.5 km region. Maximum reflectivities in the bright band were mostly 35-45 dBZ.
The transition of the precipitation character around 1800 UTC 3 November coincided with a change in the airflow. Prior to 12Z the winds were NE below 2 km and SW above. After 12Z ESE to SE winds appeared at 2 km and slowly built upward and downward until the flow throughout the depth of the precipitation was ESE to SE ( Fig. 16), except for shallow downslope reversal flow down the Toce river valley to the vicinity of S-pol, which was observed in detail by the Dopper on Wheels.
During this IOP, the Merlin made two microphysical flights. The first flight sampled the weak stratiform precipitation to the southwest of the S-Pol. The second flight from about 0830-1050 UTC 4 November was most likely the best microphysical flight obtained during MAP. Legs were flown from 7000 to 15000 ft altitude at 2000 ft intervals through moderate intensity echo (35-45 dBZ bright band). The flight legs were above and below the melting layer and were aligned with the S-Pol's 360 radial for high-resolution comparison with polarimetric parameters Fig. 17. The Electra also obtained high-resolution microphysical measurements in a descending trapezoid along the 230 and 255 radials as shown in Fig. 18, from 17,000 ft downward at 2,000 ft intervals. However, the precipitation weakened considerably in this area while the Electra was on station and one of the Electra's three particle probes was unoperable at the time.
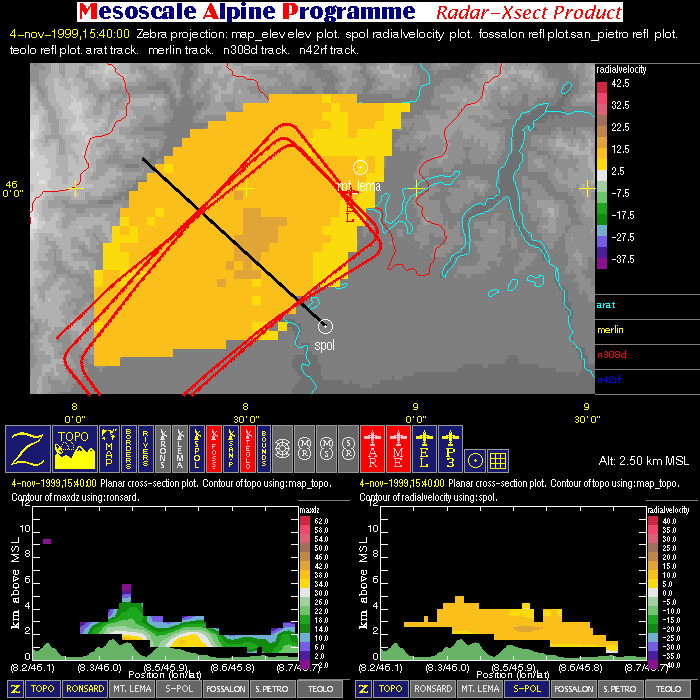
The ARAT flew to the Ligurian and sampled the upstream flow from the Liguran sea. En route, the ARAT encountered severe icing conditions. The P-3 and Electra flew in the Lake Maggiore region from about 1040-1230 UTC 4 November and the Electra from 1300-1700Z. Worthy of note is the flow mapping flights made during this time period over the Lake Maggiore area. During this period all ground based project radars (Ronsard, Mt. Lema, S-Pol and DOW) were also collecting Doppler velocity data. This should lead to an unprecedented detailed mapping of the airflow evolution over mountainous terrian as many bands of precipitation developed and moved through the area (e.g., Fig. 19).