Washington State
My first overhead illustrates Precipitation vs. Elevation. I randomly
chose 16 cities and/or sites in Washington State and plotted their elevation
and annual precipitation. The plotted cities/sites from left to right are
as follows: Neah Bay, UW, Point Grenville, Bellingham, Sequim, Snoqualmie
Falls, Wenatchee, Baring, Yakima, Leavenworth, Ellensburg, Cedar Lake,
Cle Elum, Lake Wenatchee, Snoqualmie Pass, and Stevens Pass. This graph
shows that precipitation is not necessarily positively correlated with
elevation. In other words, as elevation increases, the amount of rainfall
does not necessarily increase. I did, however, find that there is a correlation
between cities and their proximity to the Pacific Ocean, the Olympic National
Forest and the Cascade Mountains.
My second graph, Precipitation vs. East to West, illustrates this point.
I plotted eight of the previous cities/sites from their location East to
West. As you can see, Neah Bay which sits right on the edge of the Peninsula
gets a vast amount of annual rainfall. When you move closer inland to Sequim
and UW, the precipitation levels drastically drop off. When you start to
travel closer to the Cascade Mountains the precipitation levels increase
and become very high through the Passes. After descending from the Mountains
to Leavenworth and Wenatchee, the cities show a small amount of rainfall
because they are in a "Rain Shadow" caused by the mountains.

Orographic precipitation
The graphic of orographic precipitaion shows an example of how clouds
form and them precipitate as they move up a mountain slope, and how on
the other side there is a rain shadow effect and warm dry winds.

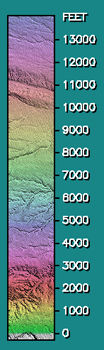
The Graphic of the rainfall shows that the areas of higher elevation
recieve on average more rainfall than the low elevations, by
comparing the rainfall chart with the elevation chart, you can see
that the olympic and the cascade mountains recieve a lot of precipitation.
The key is for the elevation graph.