
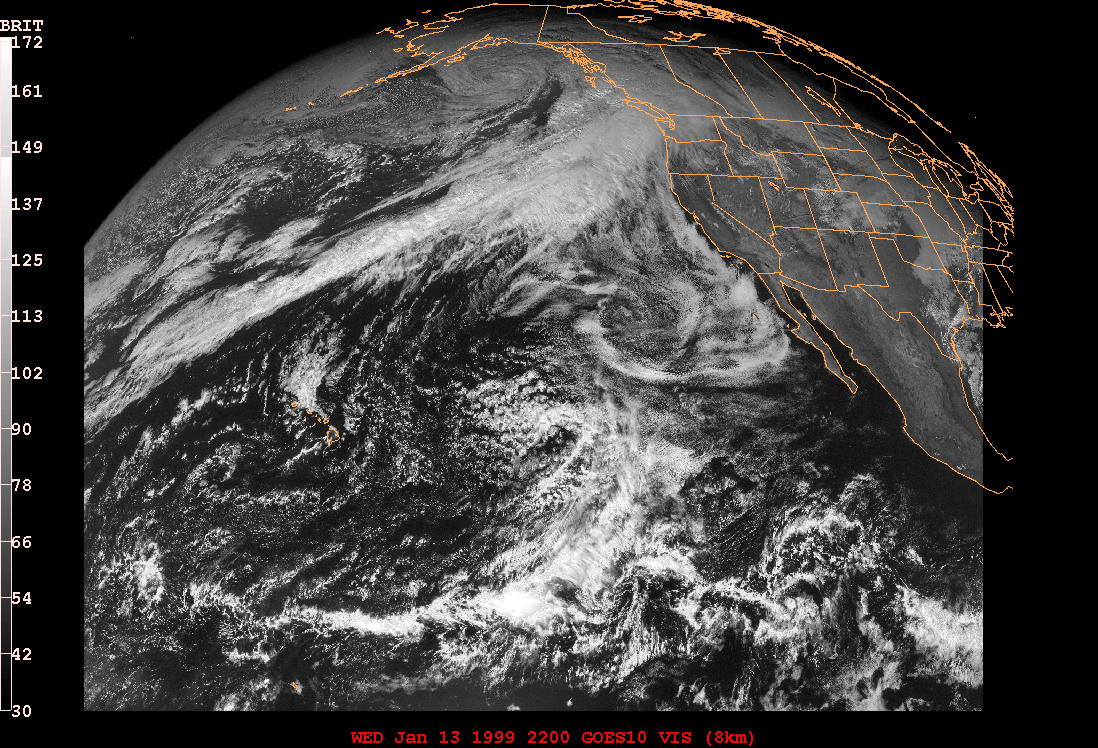
Widen your Netscape or Explorer window as much as
possible !
GOES10 satellite image - January 13, 1998 at 22:00 UTC
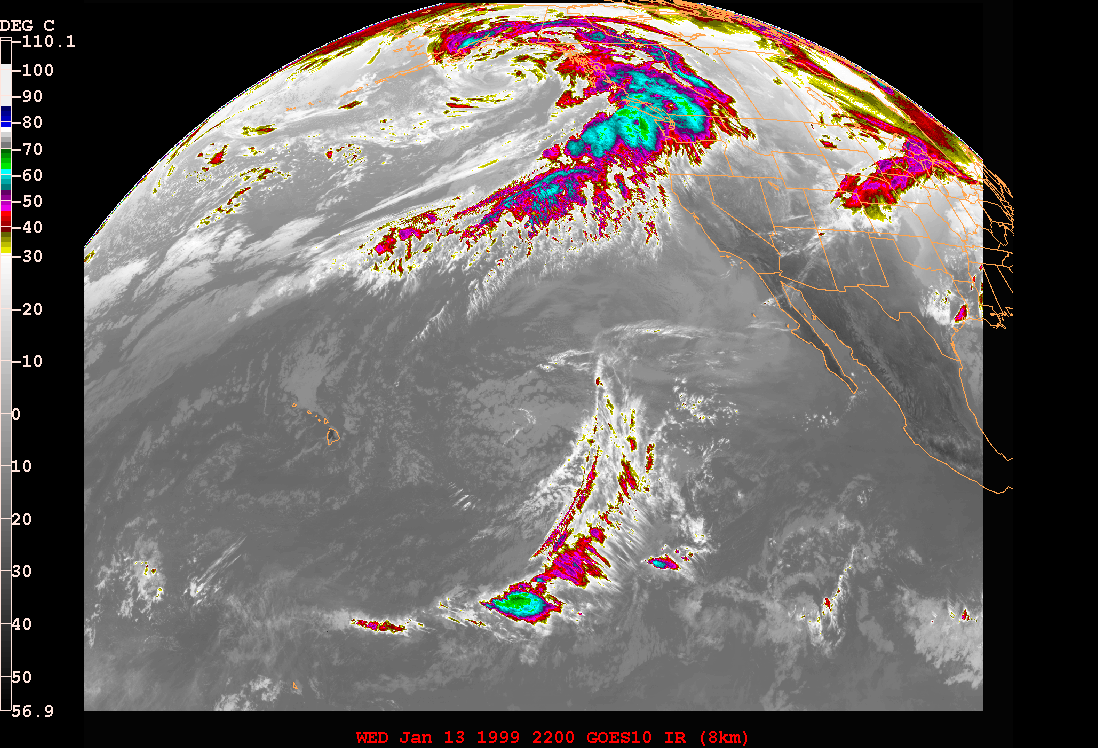
Widen your Netscape or Explorer window as much as
possible !
GOES10 satellite image - January 13, 1998 at 22:00 UTC
|
|
|
 |
 |
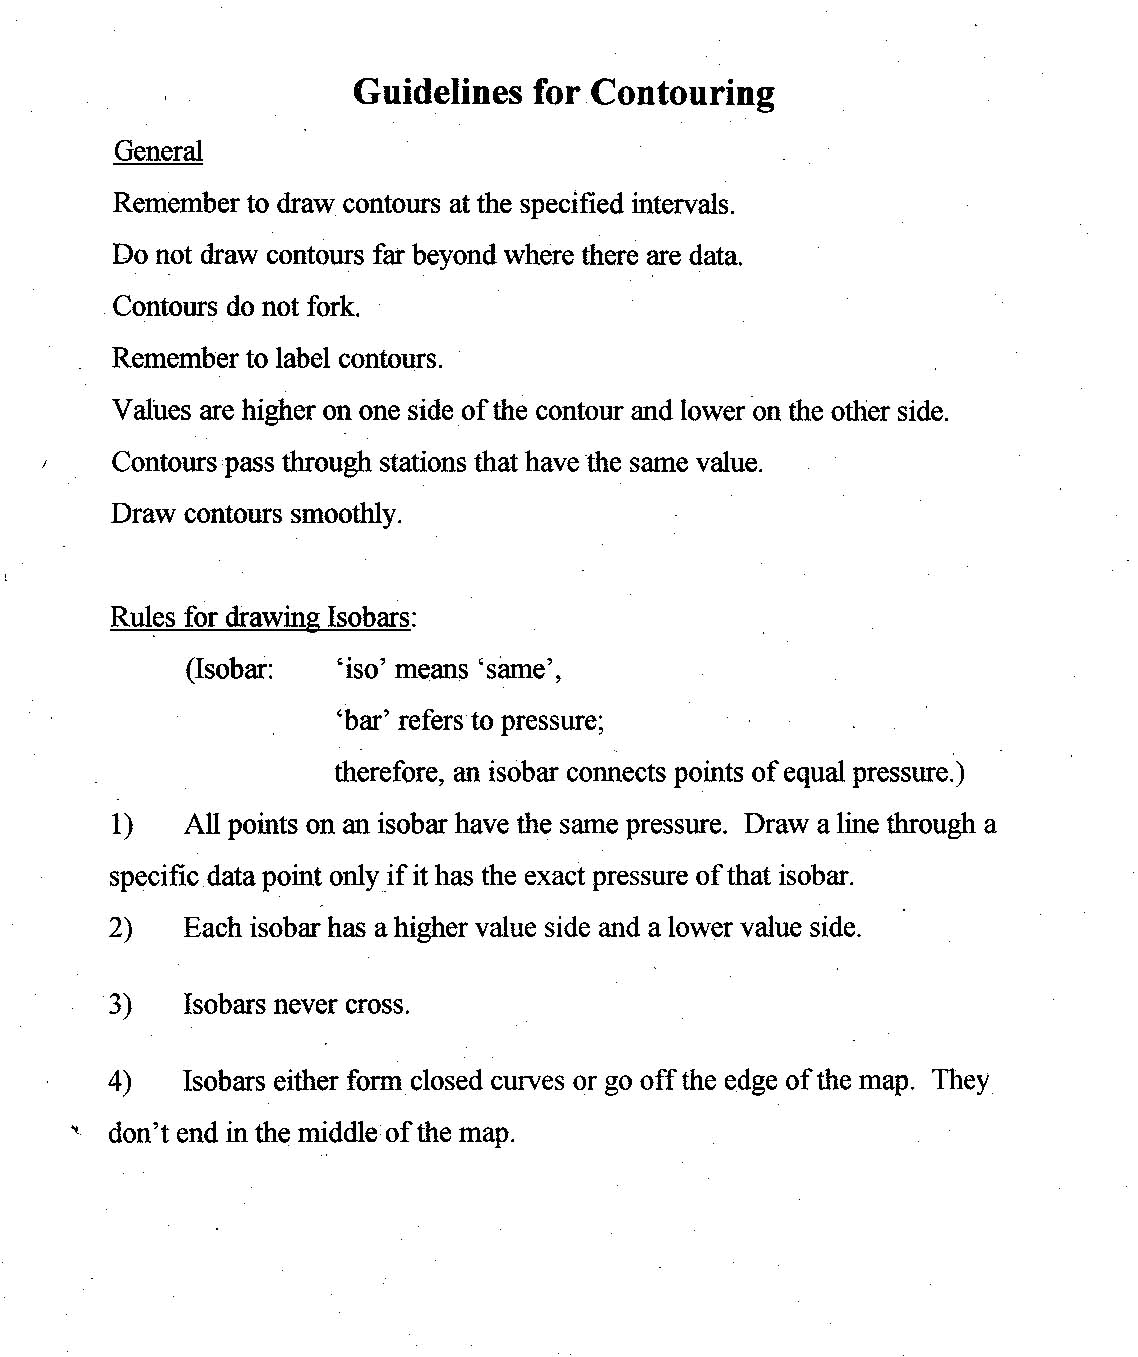
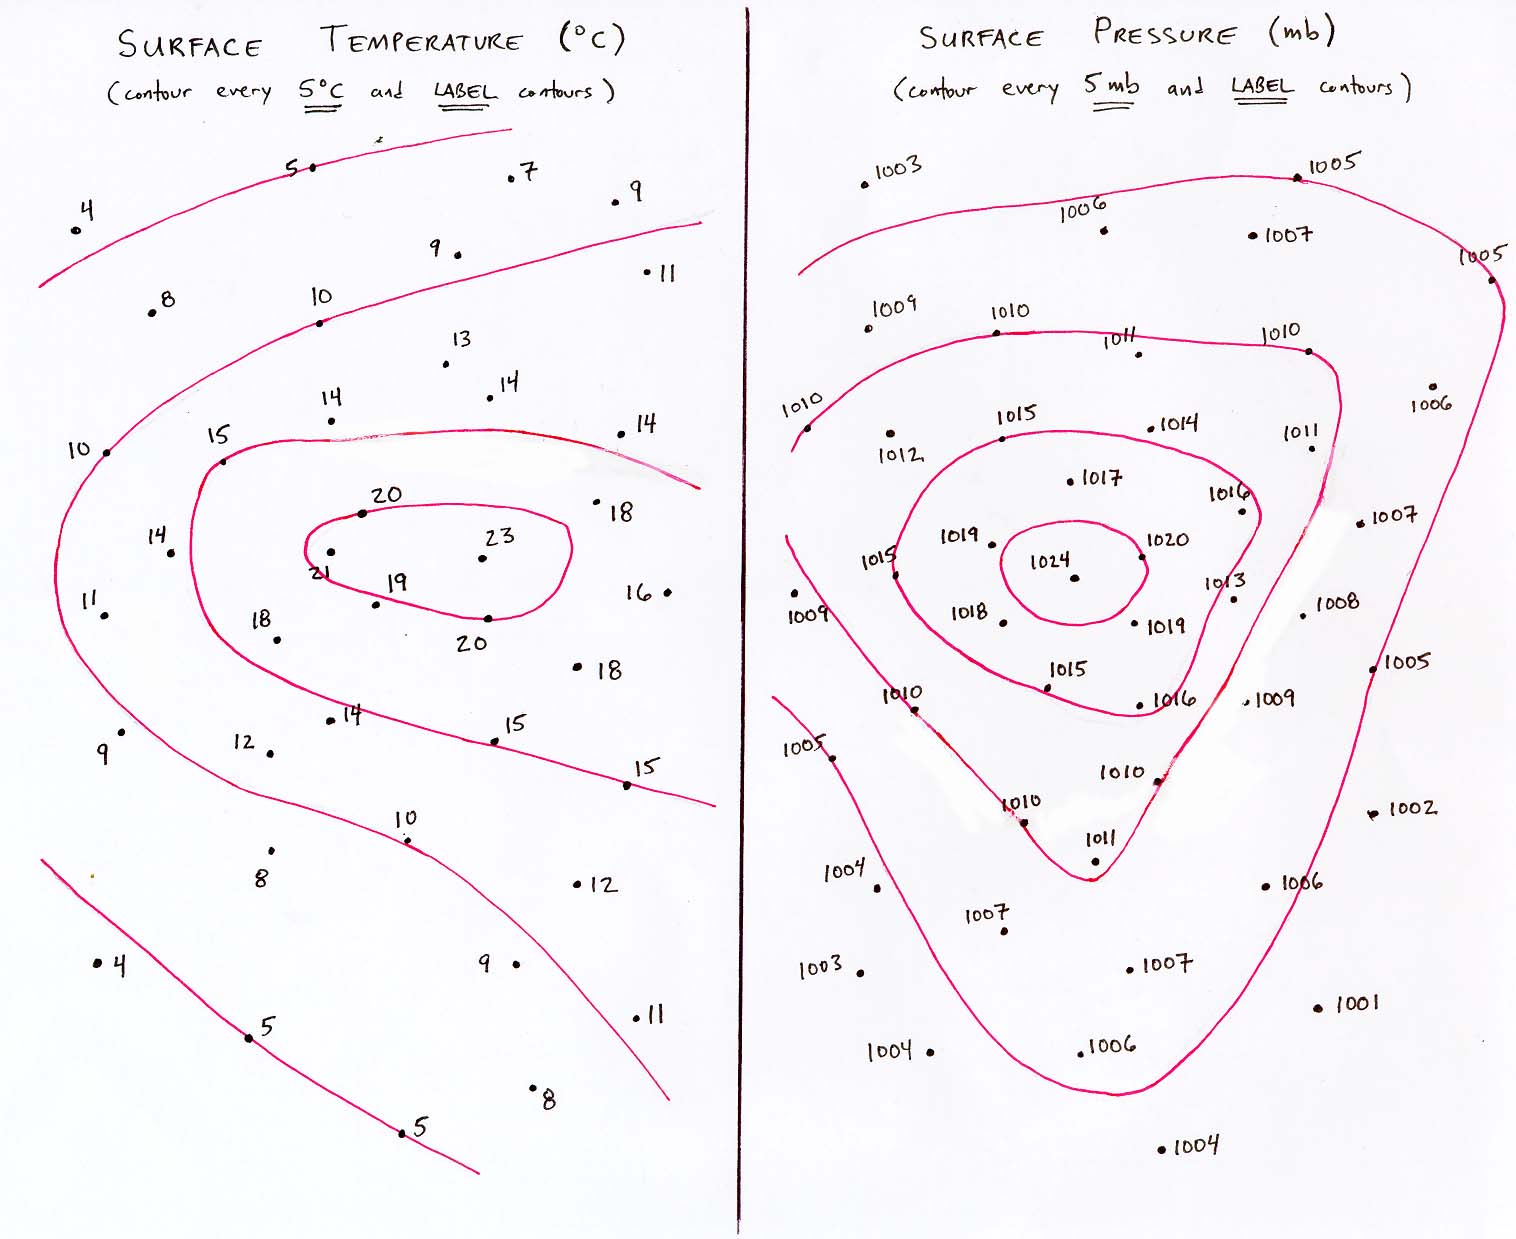
Contouring exercise
|
|
|
 |
 |
|
|
|
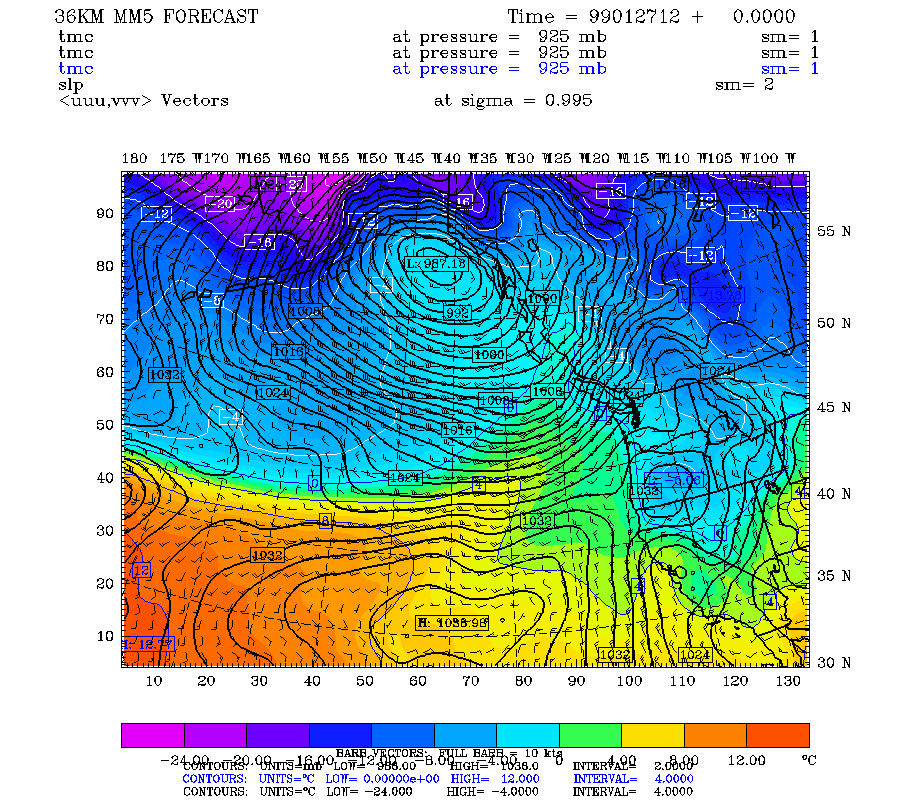
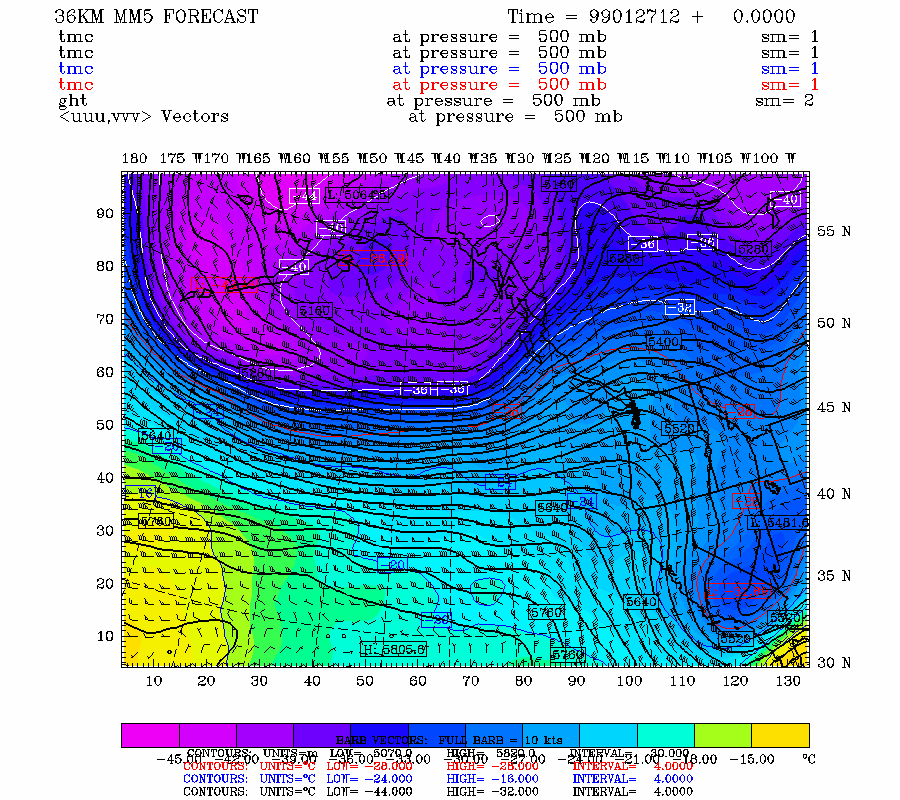
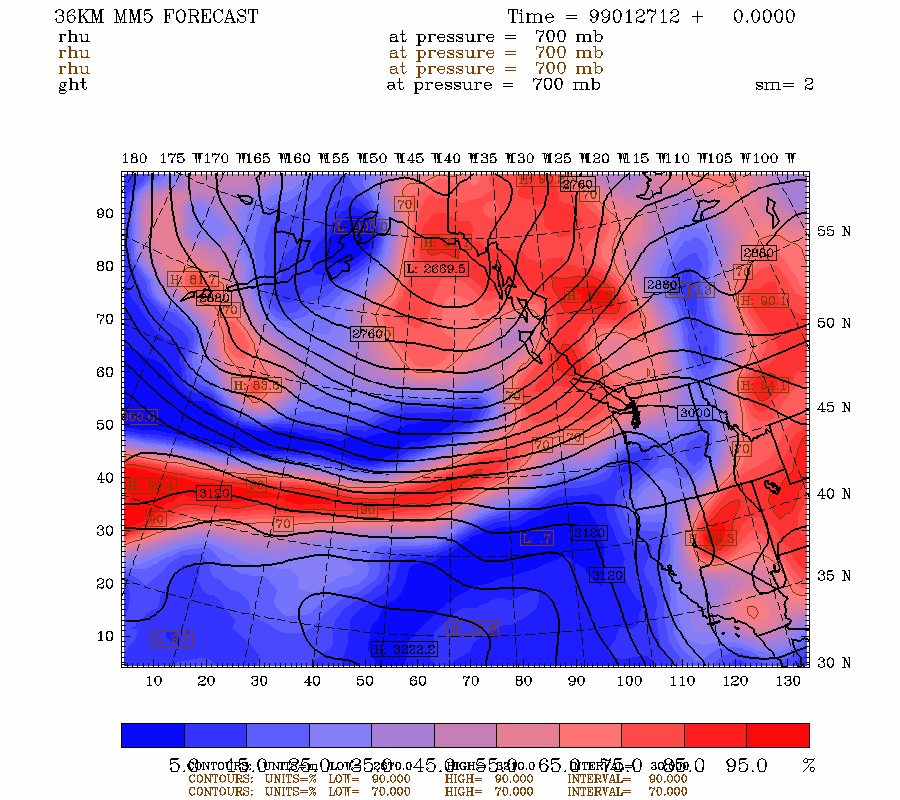
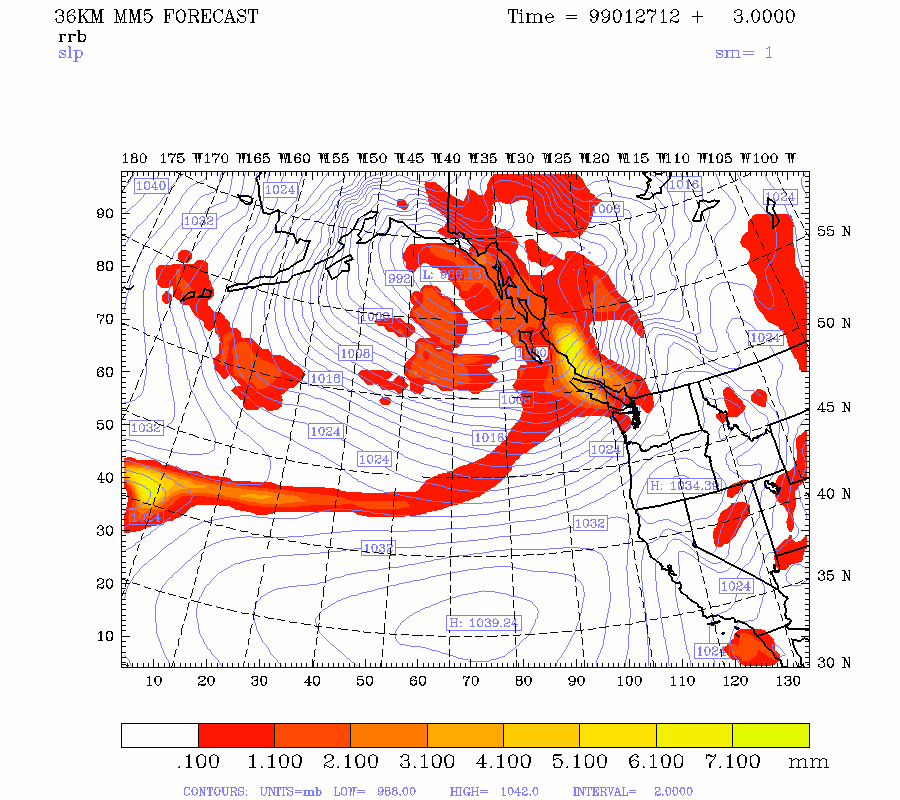
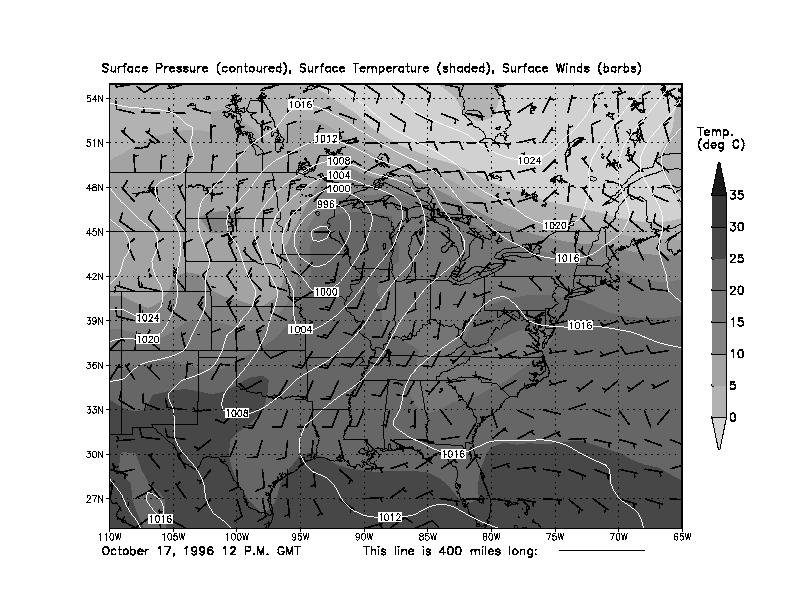
Pressure Maps
(January 27, 1999, 15Z)
|
(dark lines = isobars) (color scale = temperature) |
(id.) |
 |
 |
|
(dark lines = isobars) (color scale = relative humidity) |
(dark lines = isobars) (color scale = 3 hour-accumulated precipitation) |
 |
 |
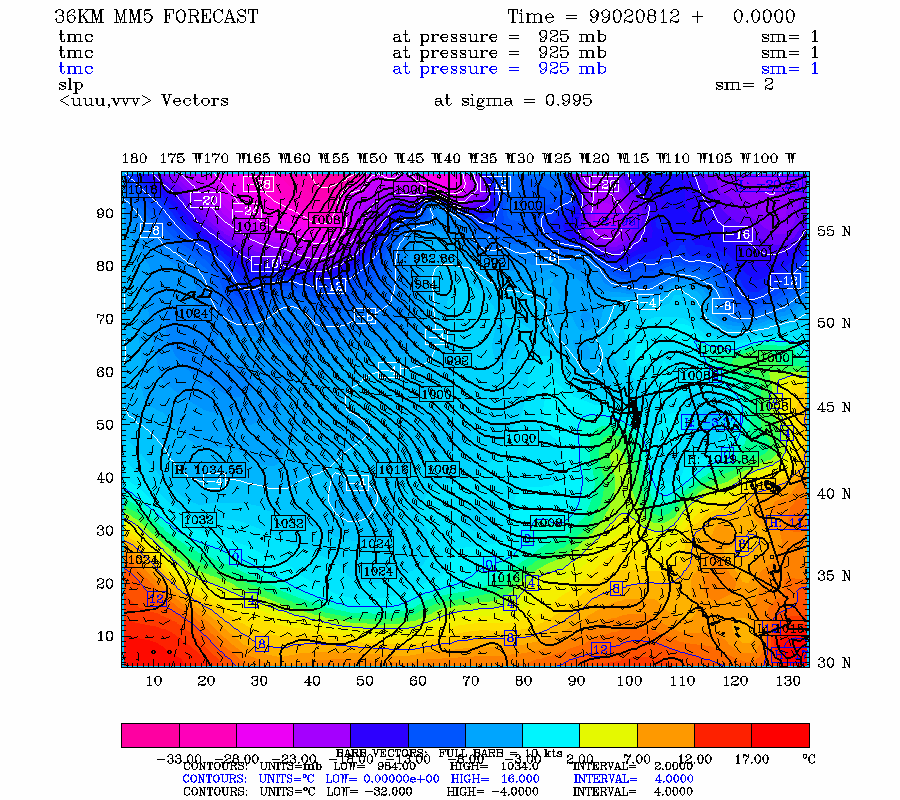
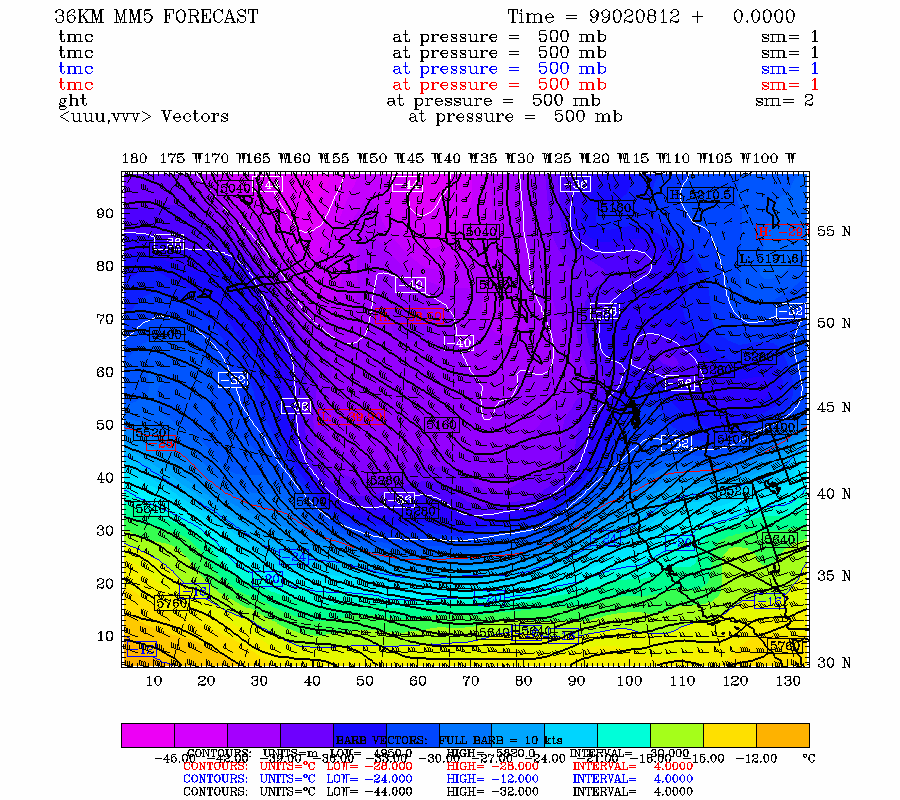
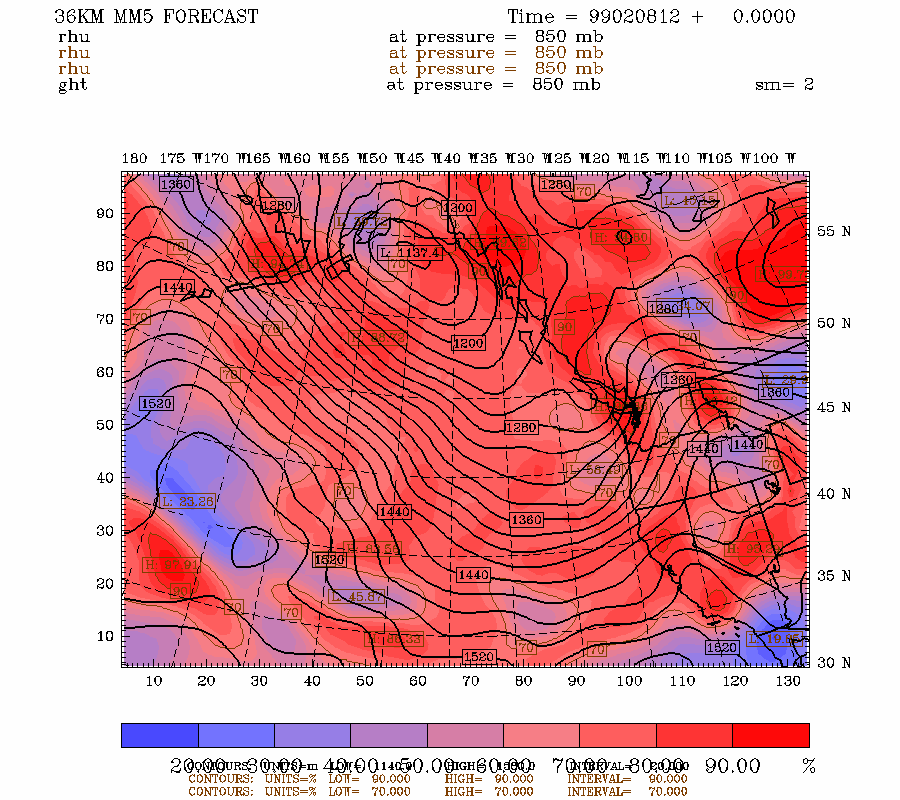
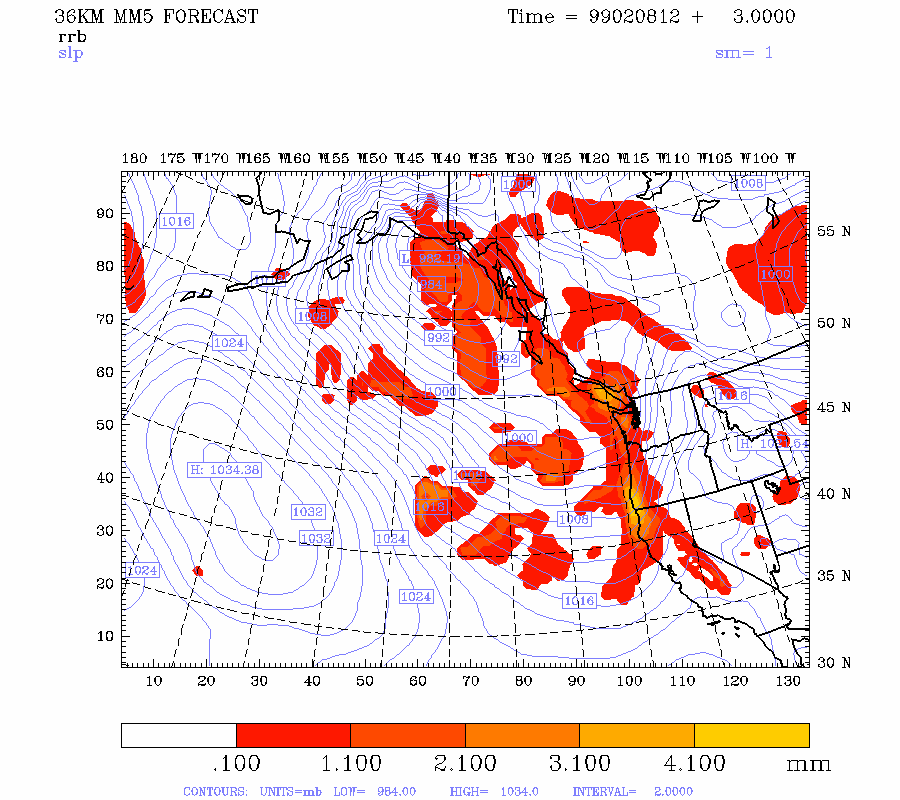
Pressure Maps
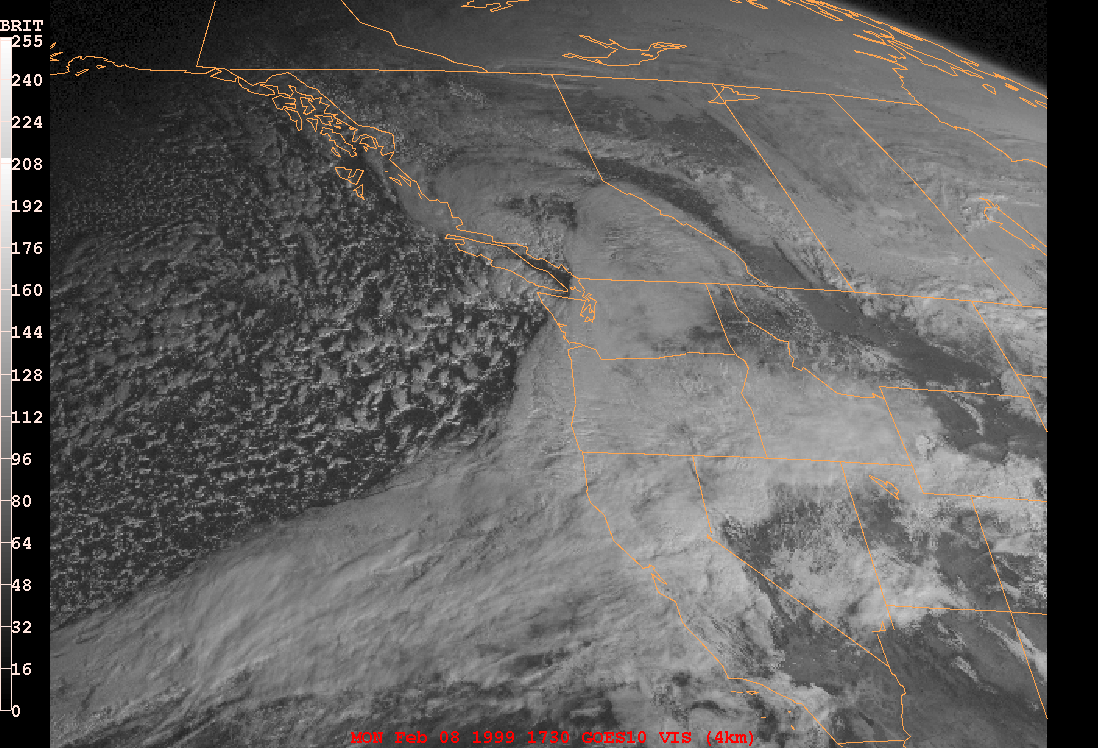
(February 8, 1999, 12Z)
|
(dark lines = isobars) (color scale = temperature) |
(id.) |
 |
 |
|
(dark lines = isobars) (color scale = relative humidity) |
(dark lines = isobars) (color scale = 3 hour-accumulated precipitation) |
 |
 |
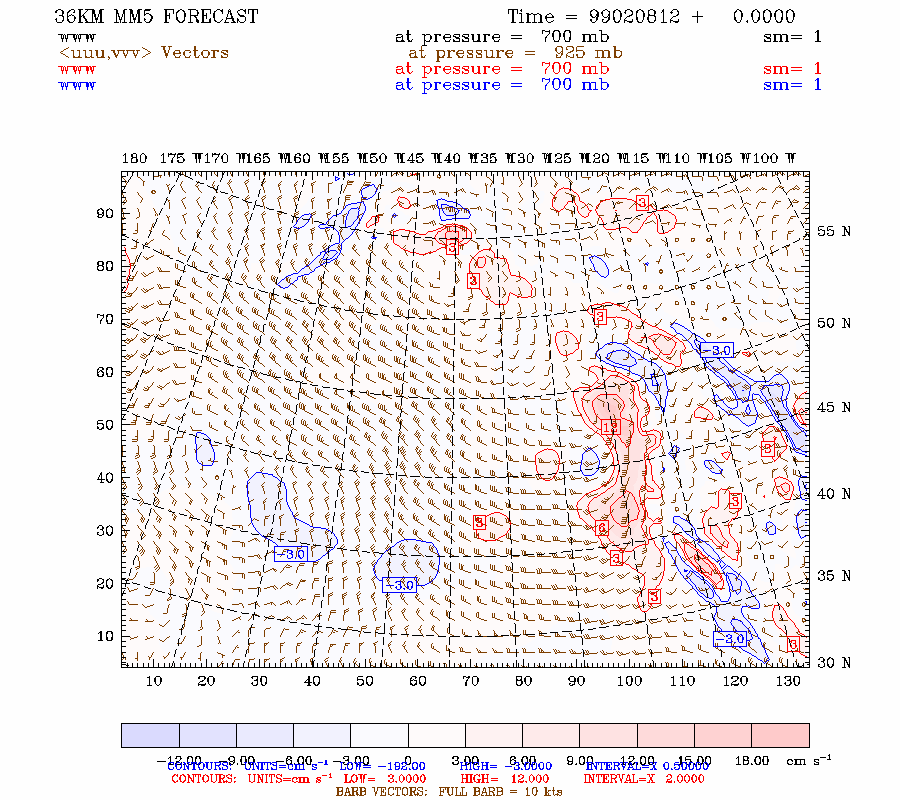
|
(red is positive velocity - lifting) (blue is negative velocity - subsidence) |
|
 |
 |
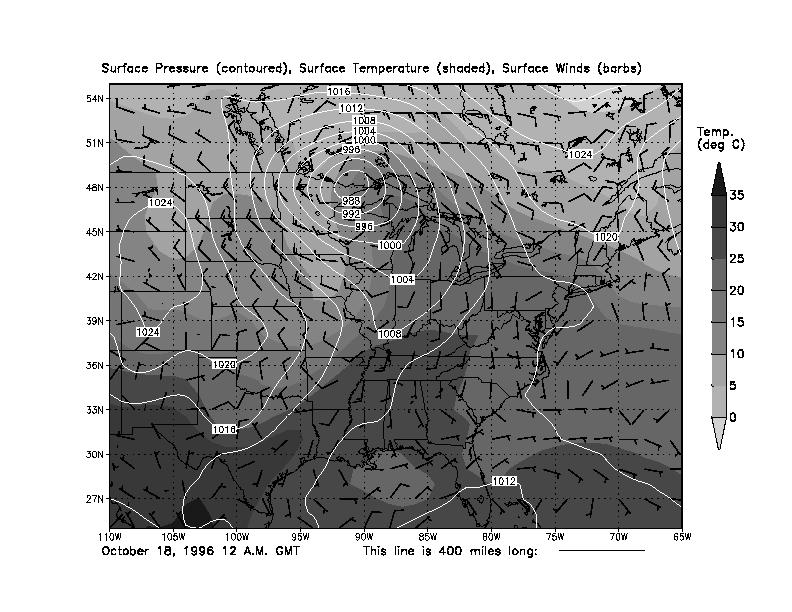
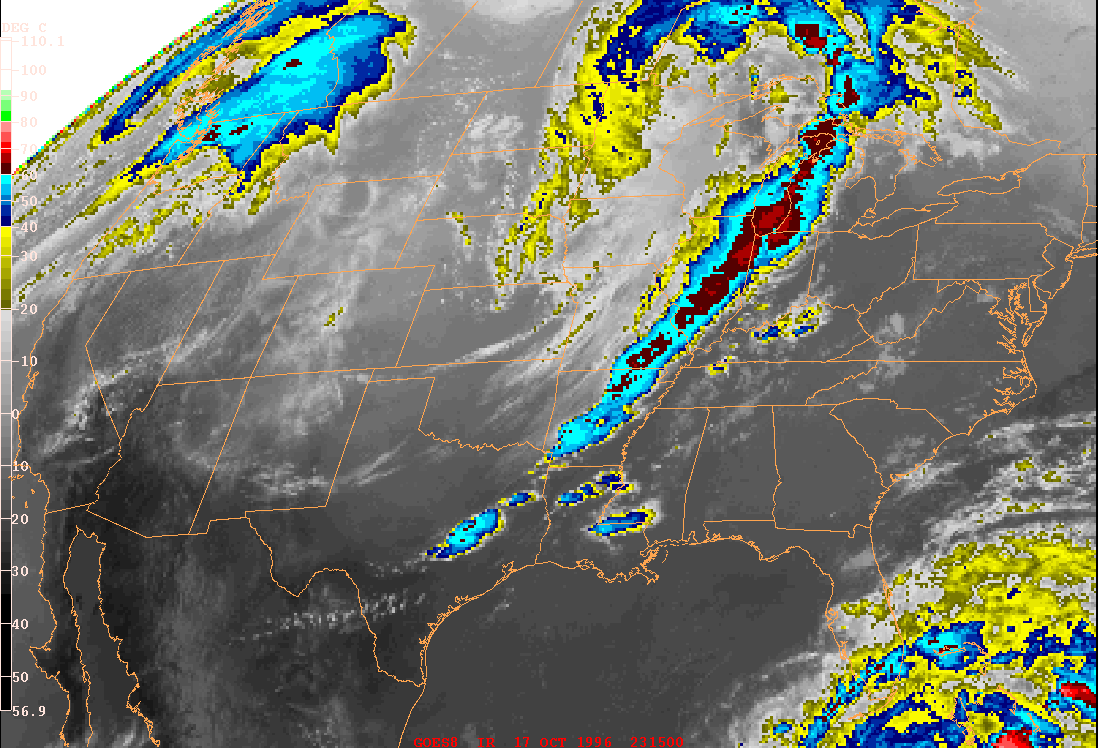
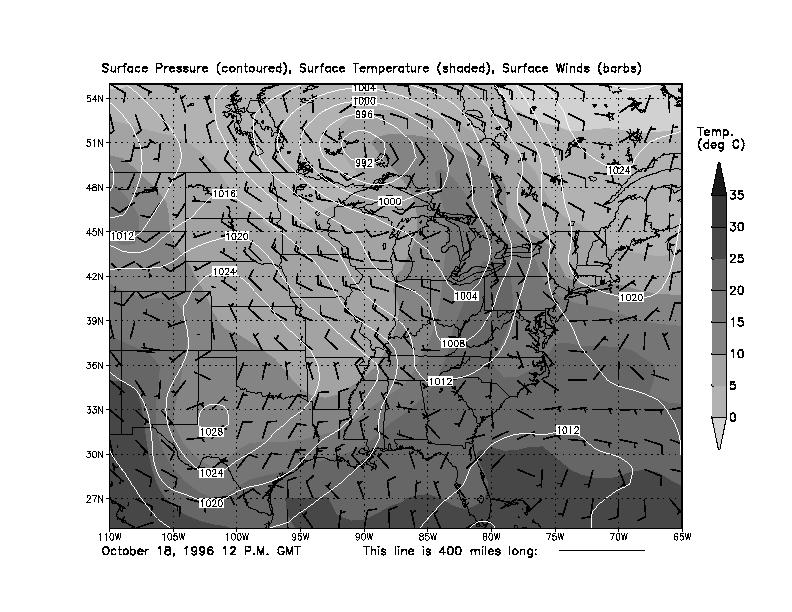
Widen your Netscape or Explorer window as much as
possible !
Click on the images to blow them up.
|
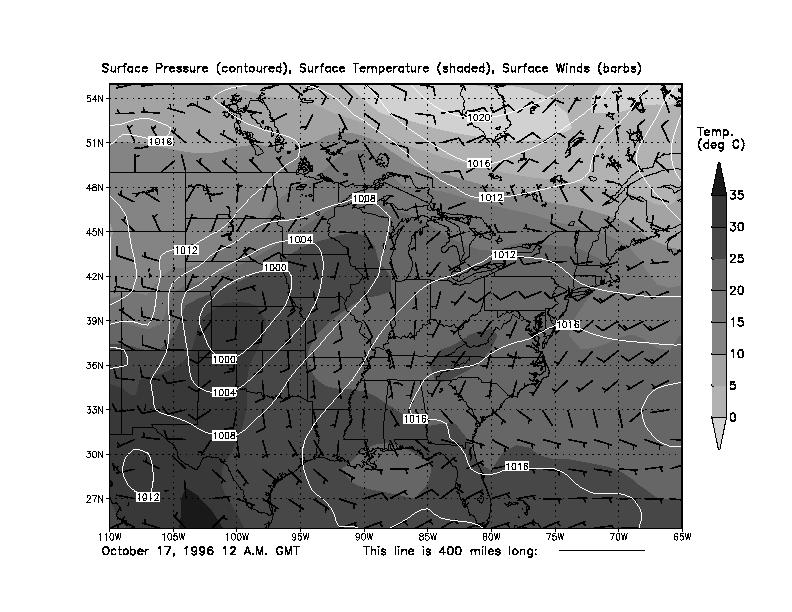
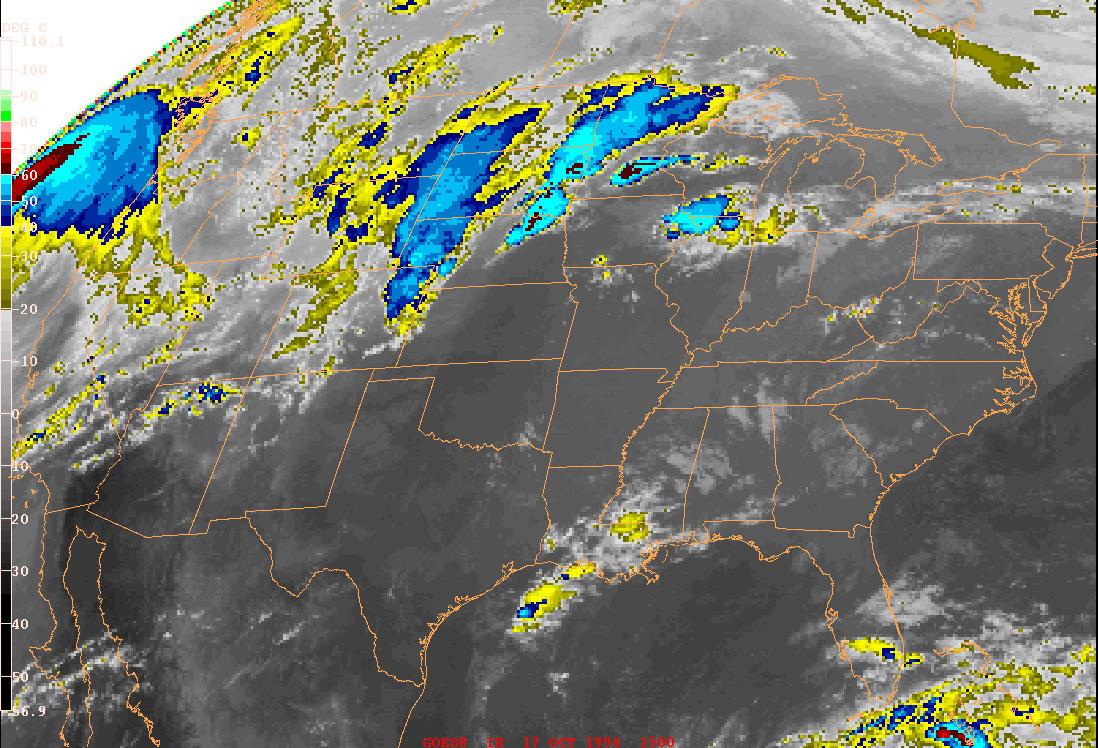
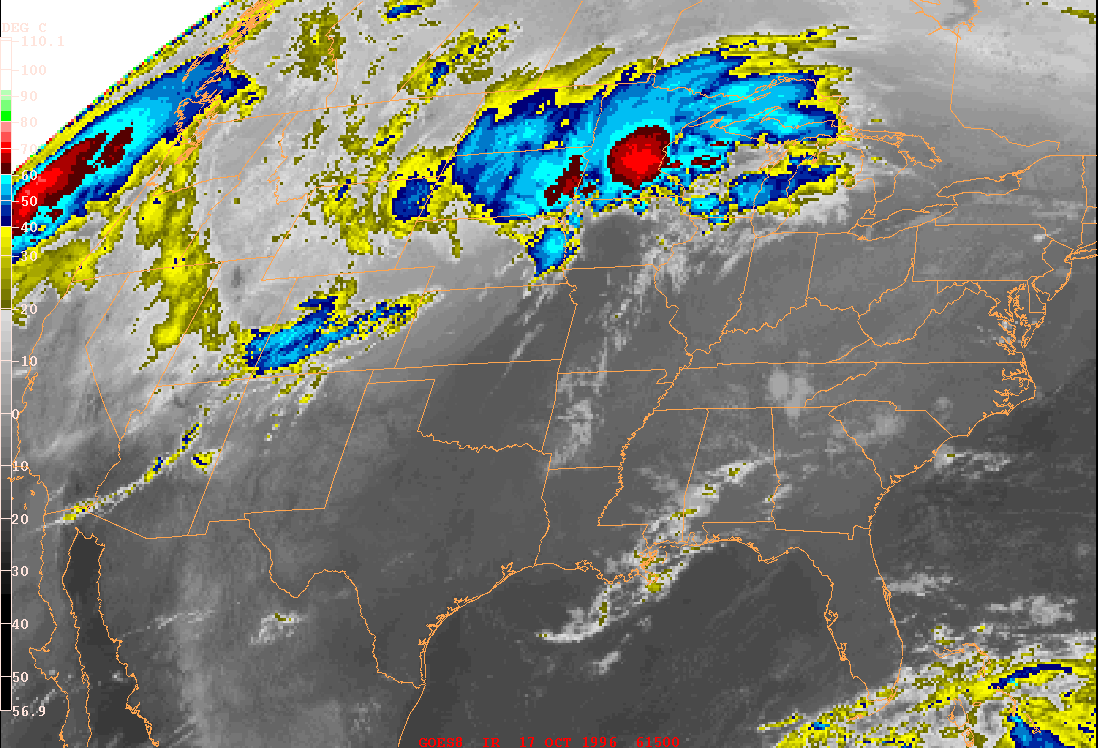
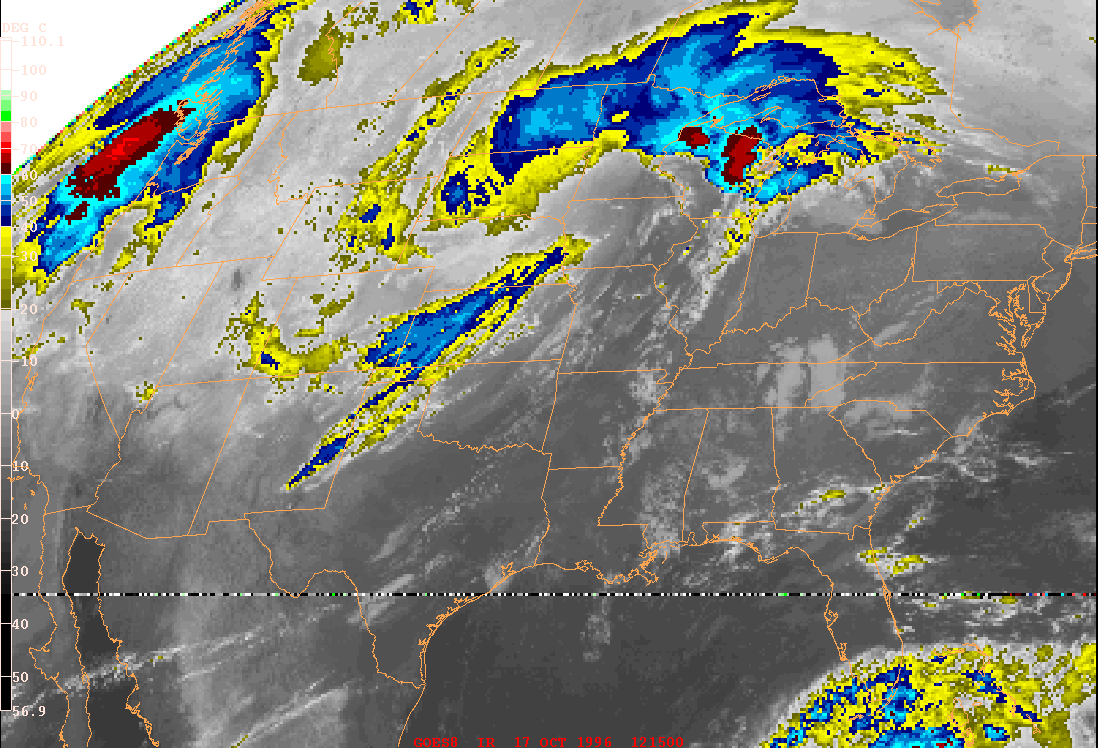
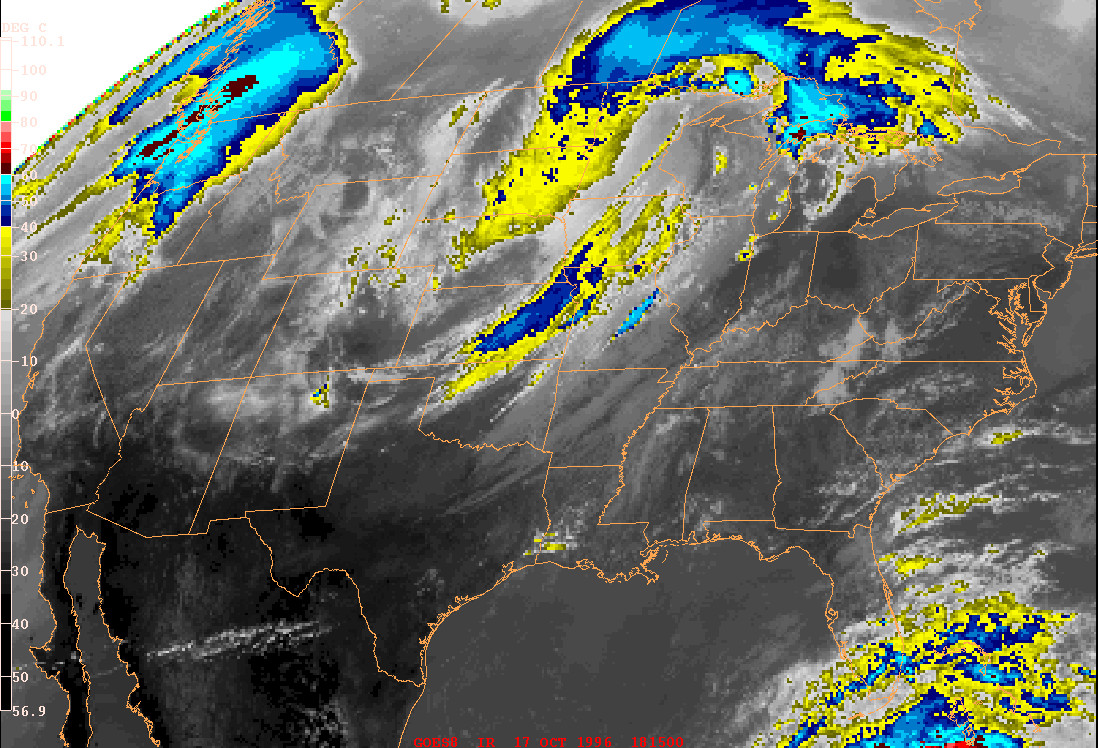
(October 17-18, 1996) |
(October 17-18, 1996) |
 |
 |
 |
|
 |
 |
 |
|
 |
 |
 |