
| Homework assignment #
1
-- DUE Wednesday April 9 2003 |
| Problem set |
a. Assume that solar radiation is absorbed only by O2 and O3 and that Earth's atmosphere is "plane perpendicular". Data for the absorption cross section of O2 and O3 is given in Table 1 below. Using Beer-Lambert Law, calculate the transmittance between the top of the atmosphere and the ground (T = Iground/Itop), from 200 to 320 nm in 20 nm intervals, for a solar zenith angle of 45 degrees assuming the total vertical column abundance of O3 is 300 DU ( 1 Dobson Unit, DU = 2.687 1016 modelcules/cm2) and the total vertical column abundance of O2 is 4.0 1024 molecules/cm2.
(hint: remember to convert the vertical
column abundances of O2 and O3 to slant column abundances,
using the solar zenith angle relation between these quantities).
b. If we neglect the roles of molecular scattering and the interactions of clouds and aerosols with the radiative field, then the amount of UV radiation reaching the surface is given by the product of the transmittance found above and the solar irradiance incident at the top of the atmosphere. Using data for irradiance as a function of wavelength given in the table, calculate the amount of UV radiation reaching the surface between 200 and 320 nm, in 20 nm intervals.
c. Comment on the relative role of O2 and O3 in shielding Earth's surface from UV radiation at various wavelengths.
d. Scientists have determined the sensitivity of DNA damage to exposure to UV radiation at various wavelengths. This function is called the "DNA action spectrum" and has been shown to agree with the spectral response of skin cancer induction in mice. A single numerical value for UV exposure, called the "DNA UV index", can be obtained by multiplying the amount of UV radiation reaching the surface at a particular wavelength by the value of the DNA action spectrum at that wavelength, and then summing the resulting products. Values of the DNA action spectrum are given in the table. Find the DNA UV index at the surface for the above calculation.
e. It is unclear whether the DNA action spectrum can be applied to the cells of humans because the DNA repair mechanisms of larger mammals are different, typically more complex, than the repair mechanisms of mice. Nonetheless, it is likely that some plants and smaller mammals suffer deleterious effects due to UV exposure in a manner similar to that described by this action spectrum. During the past two decades, the total vertical column abundance of O3 at mid-latitudes has dropped by 10%. What percentage increase in the DNA UV index results from a 10% decrease in the vertical column abundance of O3 (e.g., repeat the above calculations using a vertical column abundance for O3 of 270 DU)?
Table 1. Oxygen and ozone cross sections as a function of wavelength.
|
(nm) |
(cm2) |
(cm2) |
(Photons/cm2/s) |
|
|
|
|
|
|
|
|
|
|
|
|
|
|
|
|
|
|
|
|
|
|
|
|
|
|
|
|
|
|
|
|
|
|
|
|
|
|
|
|
|
|
|
Problem 2. Use the Ozone and UV radiation interactive
web interface to answer the following questions.
a) Effect of changing the latitude and the month on
the amount of UV radiation reaching the surface. Choose two different
months and read from the graphs the resulting percentage change in UV radiation
reaching the surface at 280 nm, 300 nm, and 320 nm (relative to the standard
case which is July , 20N, 300 DU). Repeat the same thing with two different
latitudes. The graphs will also display the solar zenith angle (SZA)
for the given month and latitude. How does the relative change in
actinic flux numerically relate to the change in SZA?
b) Effect of changing ozone column. The plot below (taken
from the WMO recent report on Scientific Assessment of Ozone Depletion)shows
the observed dependence of changes in ultraviolet radiation on changes
in ozone column. Contruct a similar plot using the interactive web
interface by changing the ozone column for a few latitudes of your choice.
Start by calculating the UV change at 310 nm, then repeat the same thing
for 300 nm. Comment on the dependences you obtain.
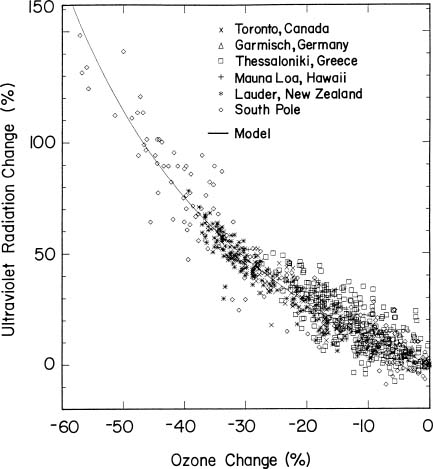
Figure 1. Increases in Erythemal (Sunburning) Ultraviolet Radiation
Due to Ozone Decreases. For more info on this graph go to the web site
of the "Scientific
Assessment of Ozone Depletion: 1998" .
Last Updated:
04/01/2003