Cecilia Bitz, Physicist
Marta Kryntzky, 2005 Graduate in Oceanography
Polar Science Center, Applied Physics Laboratory
University of Washington
1013 NE 40th Street, Seattle, WA 98105, U.S.A.
From the collapse of major fisheries to
the disintegration of sea ice and floating ice shelves, recent polar
climate change has captured the attention of the public. Climate
models predict the environment will continue to change in response to
increasing levels of greenhouse gases in Earth's atmosphere, with
particularly high sensitivity in the Arctic. Life in the Arctic
is already a struggle to contend with the darkness in winter and
extreme cold, which opens northern residents to vulnerabilities unique
from the rest of the globe.
We are assessing polar climate change in the 21st century simulations of models that are participating in the IPCC Fourth Assessment Report for 2007. We are analyzing predicted climate with a focus on those variables that prove the most relevant for societal concerns. We have chosen just one emissions scenario - SRES A1B, which assumes an intermediate levels of future greenhouse gas concentrations compared to other IPCC scenarios.
Marta's work on this project is paid for by the UW Program on Climate Change. Marta also received three grants this year for her work, from The Boeing Company, The UW Space Grant Program, and The Mary Gates Foundation. She presented a poster of her work at the Mary Gates Research Symposium, and has made a web version of her poster.Cecilia is supported through the National Science Foundation grant ATM0304662.
The following figures were created for the IPCC Fourth Assessment Report. Observed sea ice concentration has decreased most in the Arctic in summer. Global climate models also show a relatively high rate of Arctic summer retreat for the 21st century, but the rate is much higher as atmospheric greenhouse gas concentrations further increase this century (See Figs 1 and 2). Sea ice thickness decreases dramatically as well (see Fig. 3). Sea ice decays much ealier in the Northern Hemisphere, so changes are smaller in the Southern Hemisphere. The delay in the Southern Hemisphere is due to thermal inertia as the ocean mixes heat deep into the Southern Ocean over the 21st century.
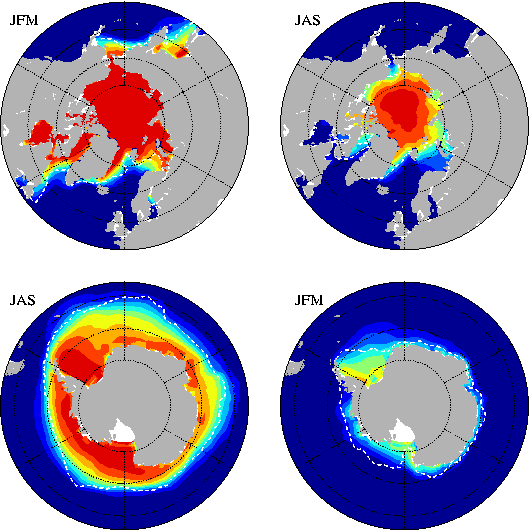 |
Fig.
1: 1980-1999 sea ice concentration averaged from 8 global
climate models for January-March (JFM) and July-September (JAS). The
dashed white lines are observed ice edge, defined as 15% ice
concentration contour) from passive microwave satellite (Comiso, 1995)
for the same period. |
 |
Scale in % for sea ice
concentration in Figs. 1 and 2. |
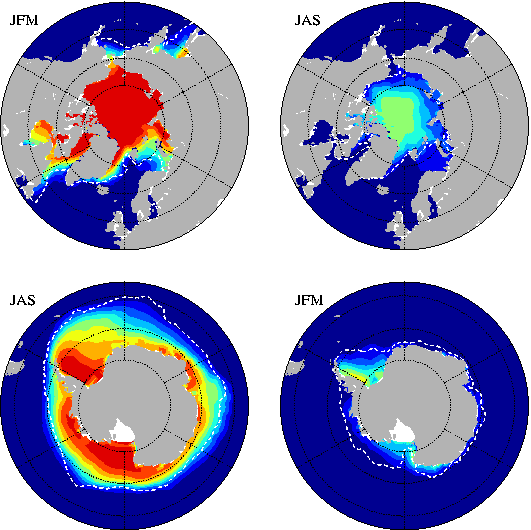 |
Fig.
2: As in Fig. 1, but for 2080-2099. Observed ice edge is
1980-1999 mean. |
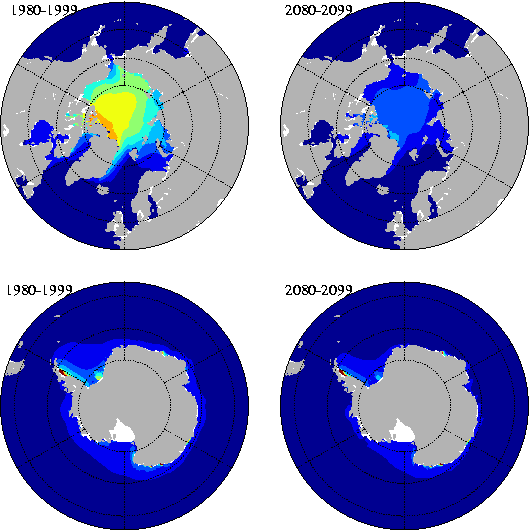 |
Fig. 3: Sea ice thickness
averaged from 8 global climate models. |
 |
Scale in meters for sea ice
thickness in Fig. 3. |