

| Fuzzy Logic Toolbox | |
Plot all of the membership functions for a given variable.
Synopsis
plotmf(fismat,varType,varIndex)
Description
This function plots all of the membership functions in the FIS called fismat associated with a given variable whose type and index are respectively given by varType ('input' or 'output'), and varIndex. This function can also be used with the MATLAB function, subplot.
Examples
a = readfis('tipper');
plotmf(a,'input',1)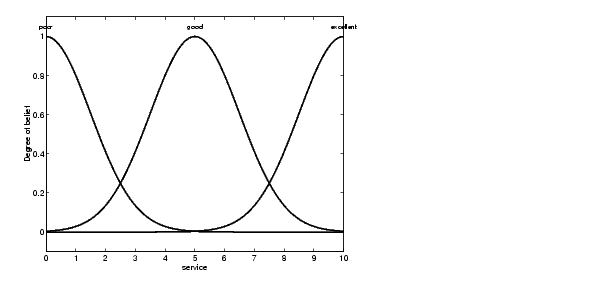
See Also
| | plotfis | psigmf | |