An active northwesterly
flow pattern continued through the first part of the
holiday break, followed by a period of cold, dry
weather. Although the OLYMPEX radars were turned off,
the ground sites and Langley Hill radar continued to
observe precipitation. This summary covers the main
active period (20 December - 25 December). A weak
frontal system also brought some precipitation on
27-December, especially around Lake Quinault.
The large scale pattern during the wet period is
illustrated by the NCEP reanalysis 500 hPa height
anomalies in Figure 1. Heights
were well below normal over the western US and British
Columbia with anomalously high heights over the
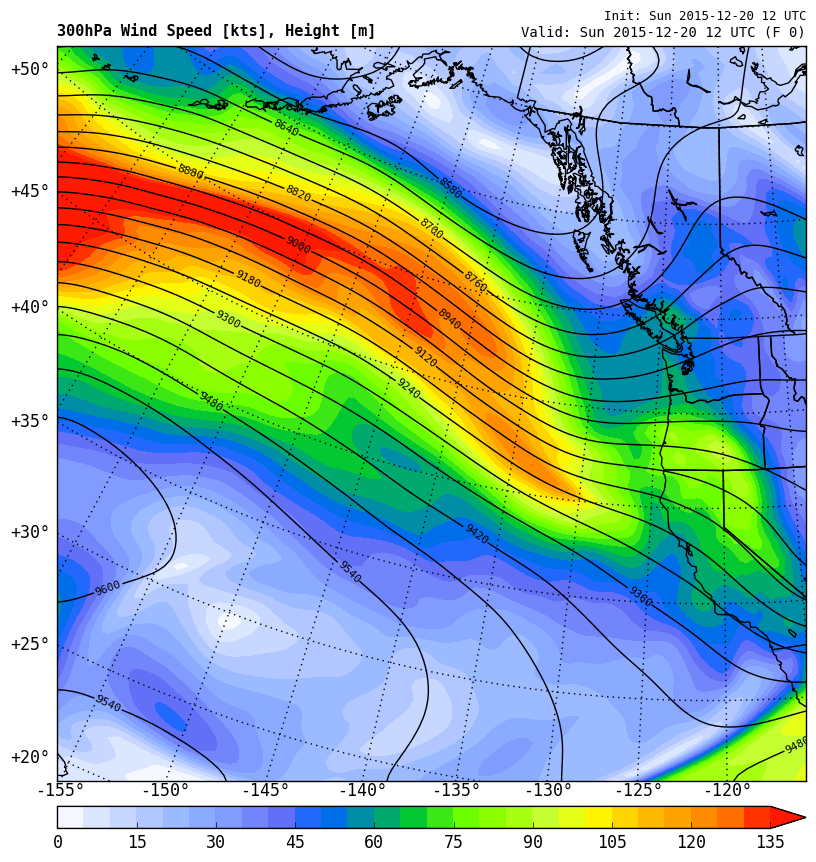
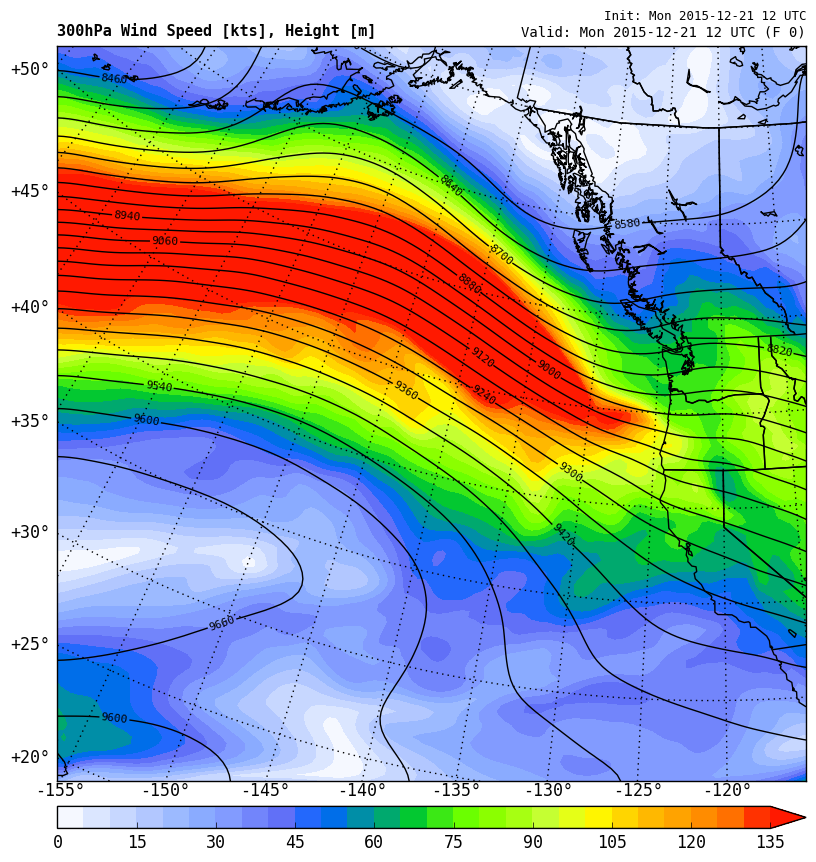
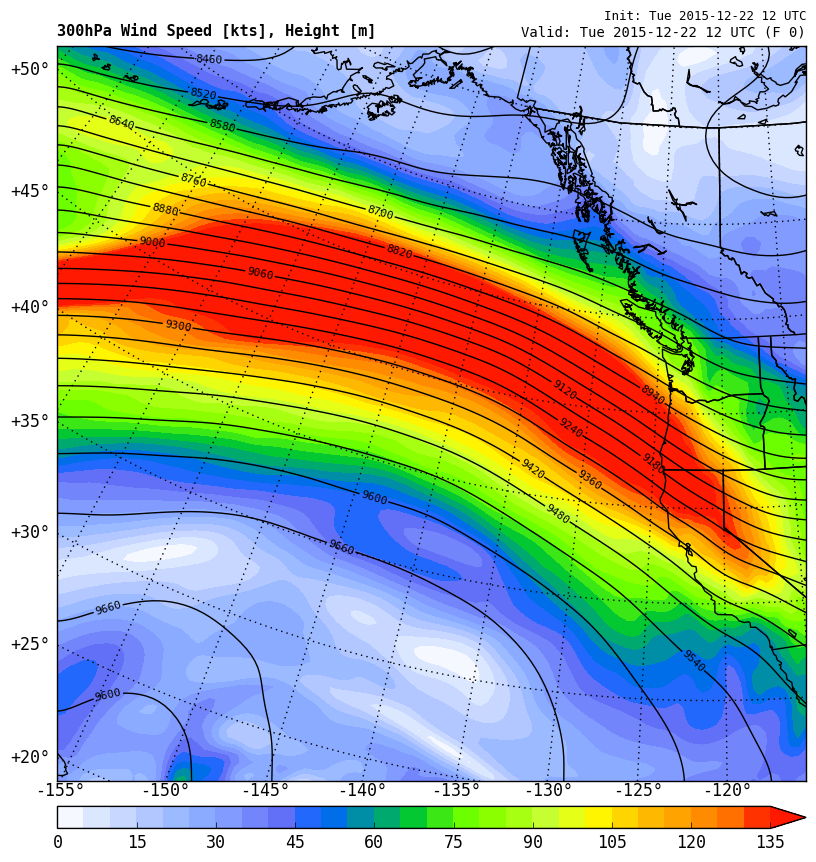
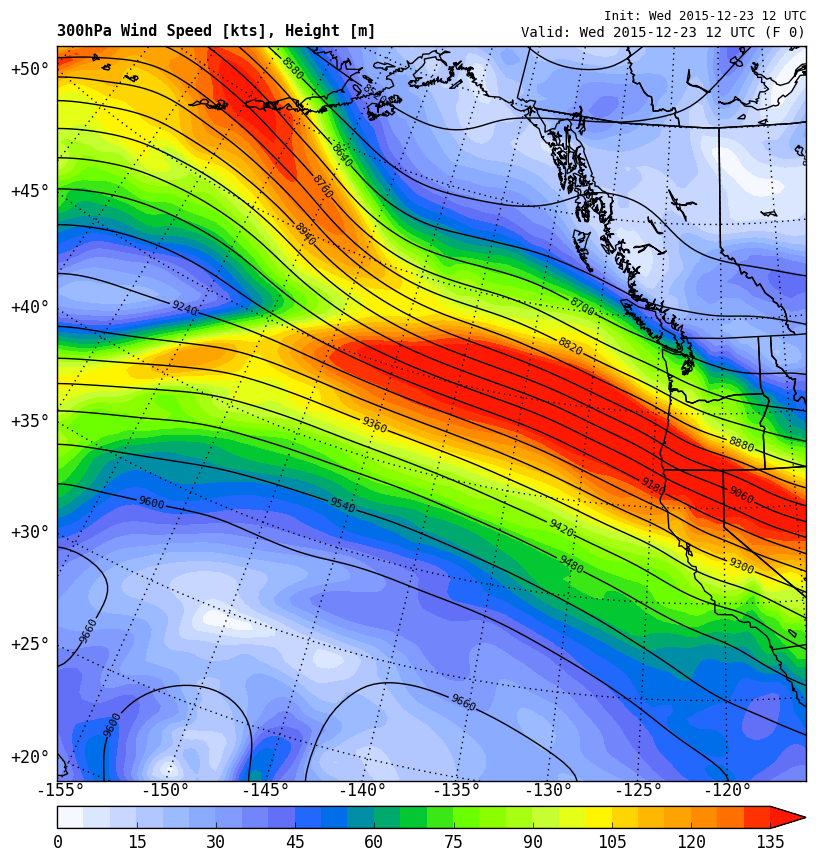
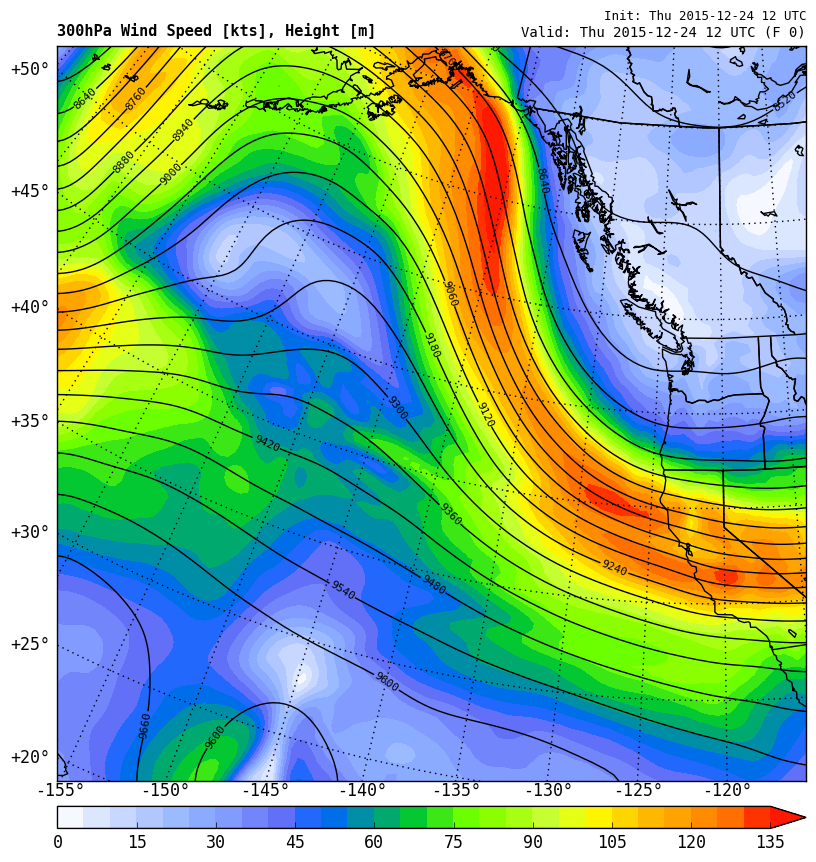
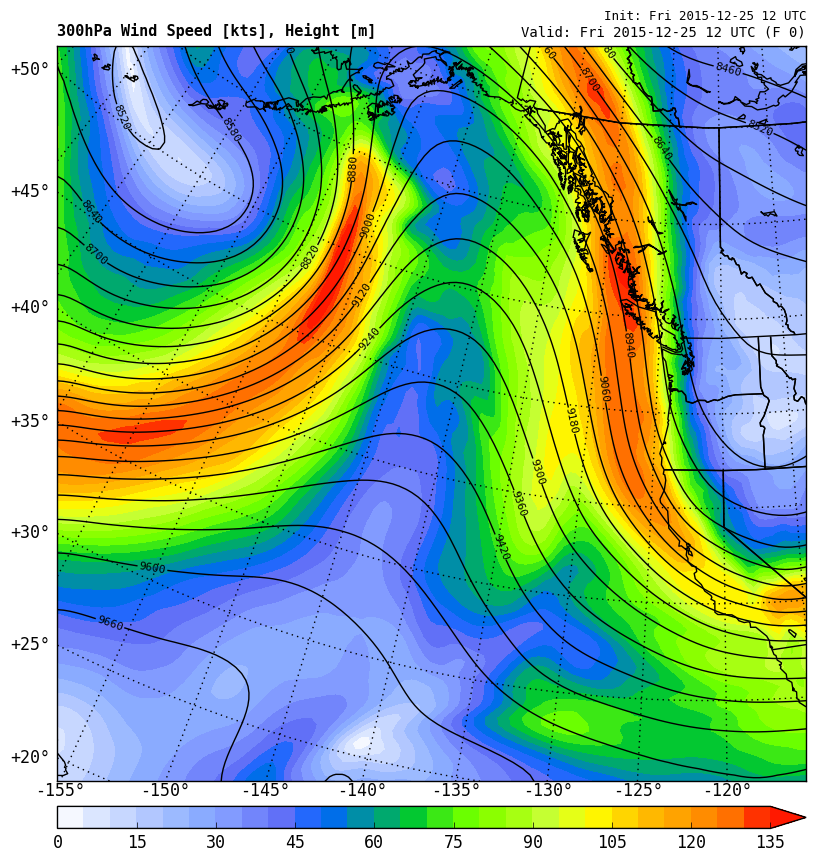
northeast Pacific. Figure 2
shows the 6-day evolution of a 160-180-kt jet streak
that moved through Oregon/northern California from
20-December to 25-December. The Olympic Peninsula was in
the colder airmass on the north side of this jet streak
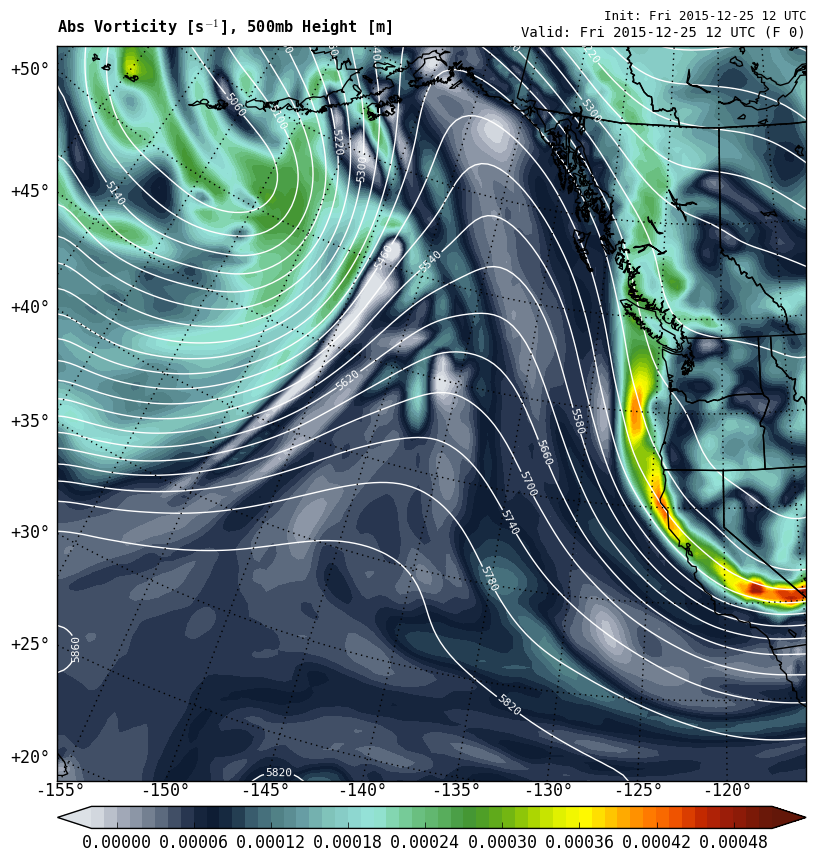
throughout the period. The pattern quickly amplified on
24-December with the 300 hPa flow becoming northerly
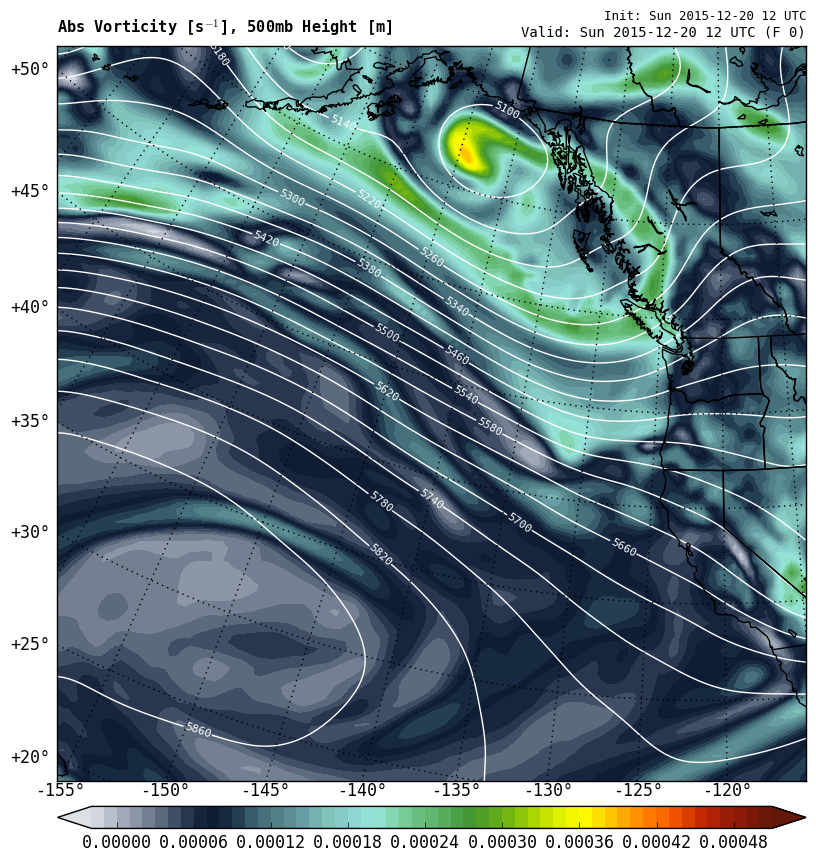
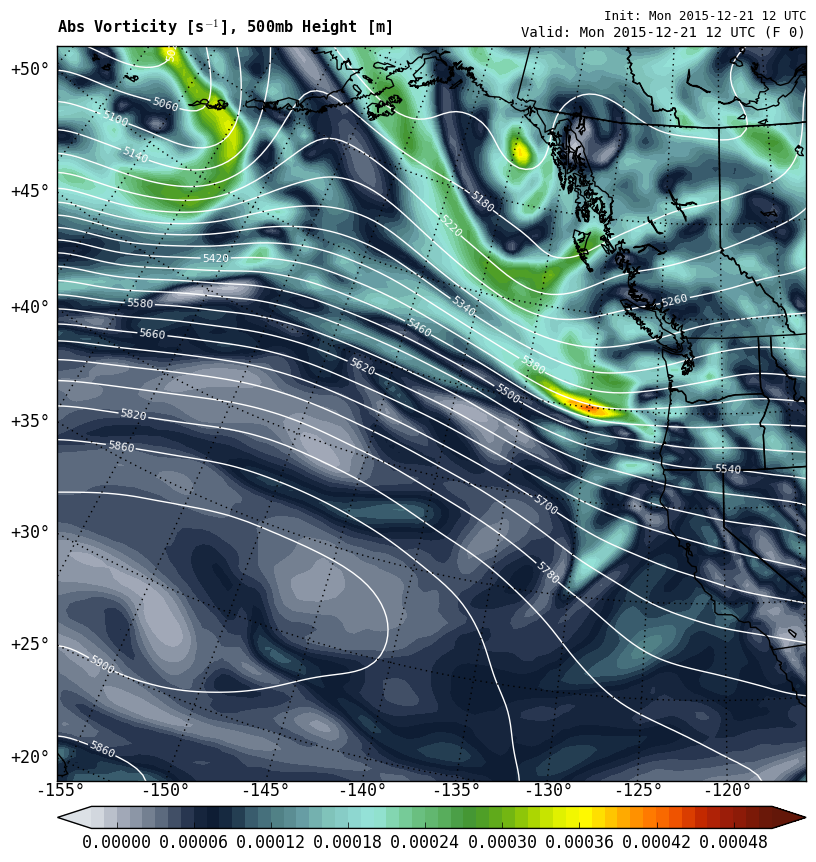
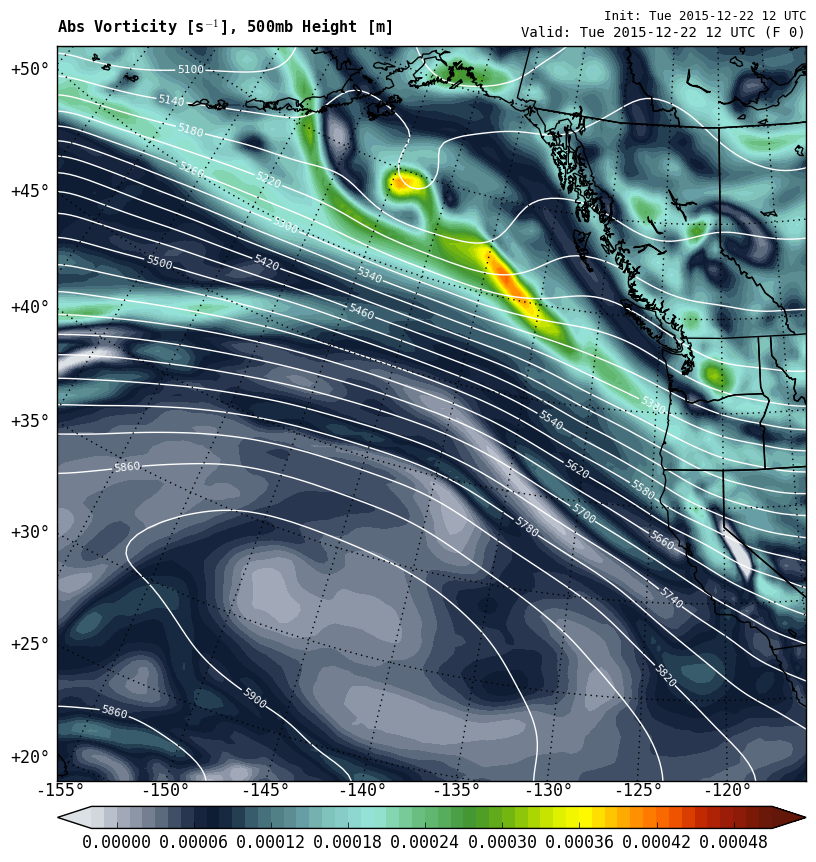
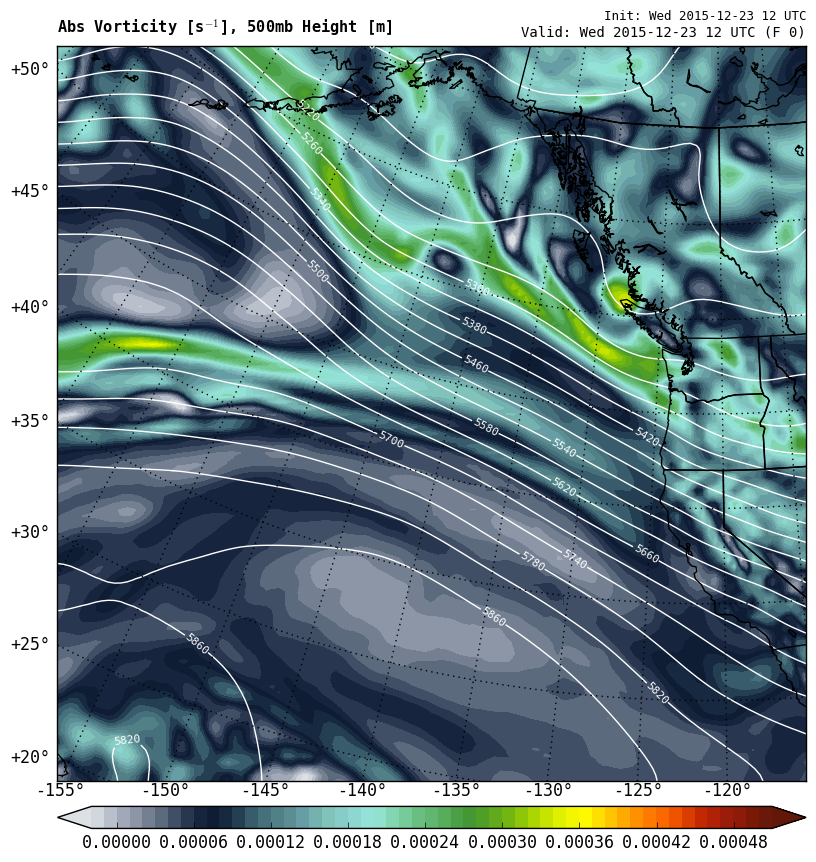
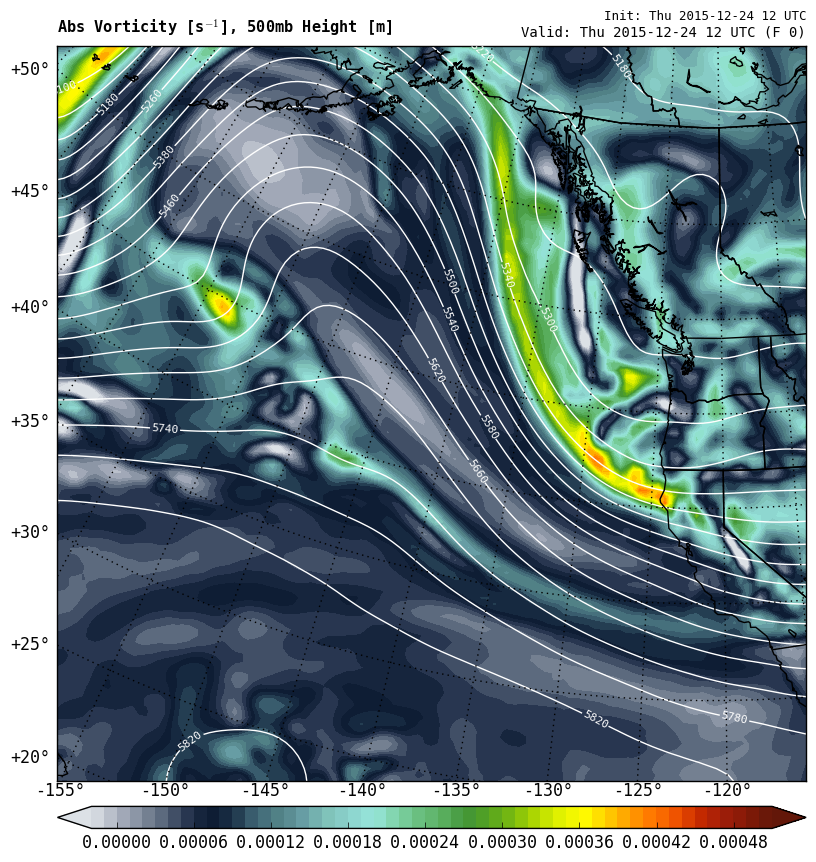
over the Olympic Peninsula by 25-December. A series of
fast-moving shortwaves formed on the northern side of
the jet. A few of these waves are apparent in the 500
hPa vorticity plots in Figure 3.
Four distinct features impacted Washington in this
period: fronts and two surface lows. The waves followed
each other in close succession and there were no
extended breaks in the precipitation.
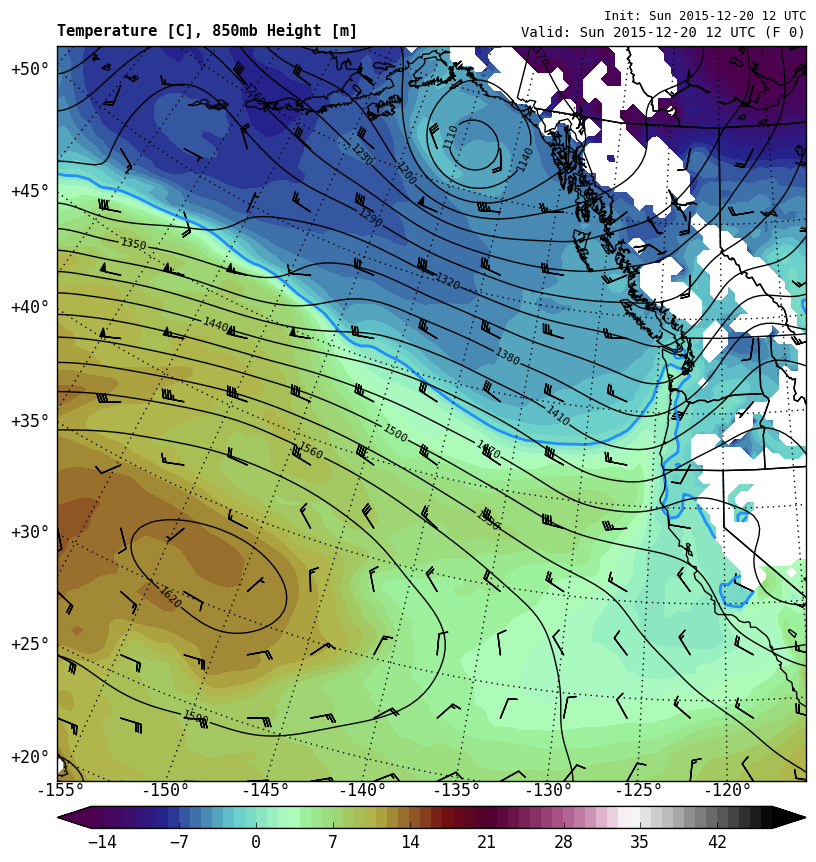
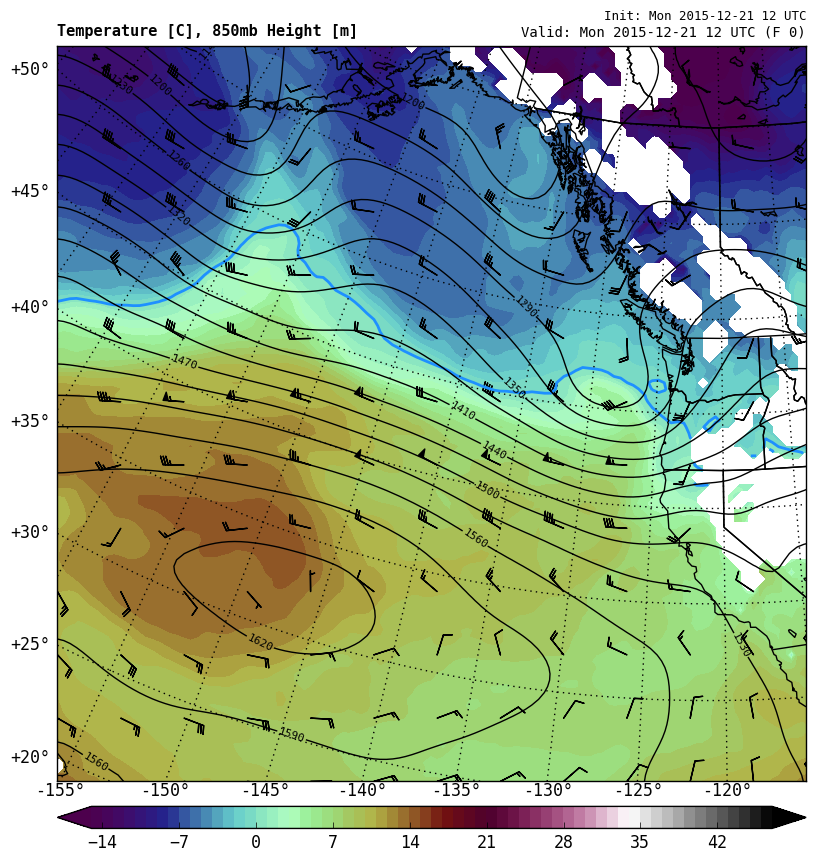
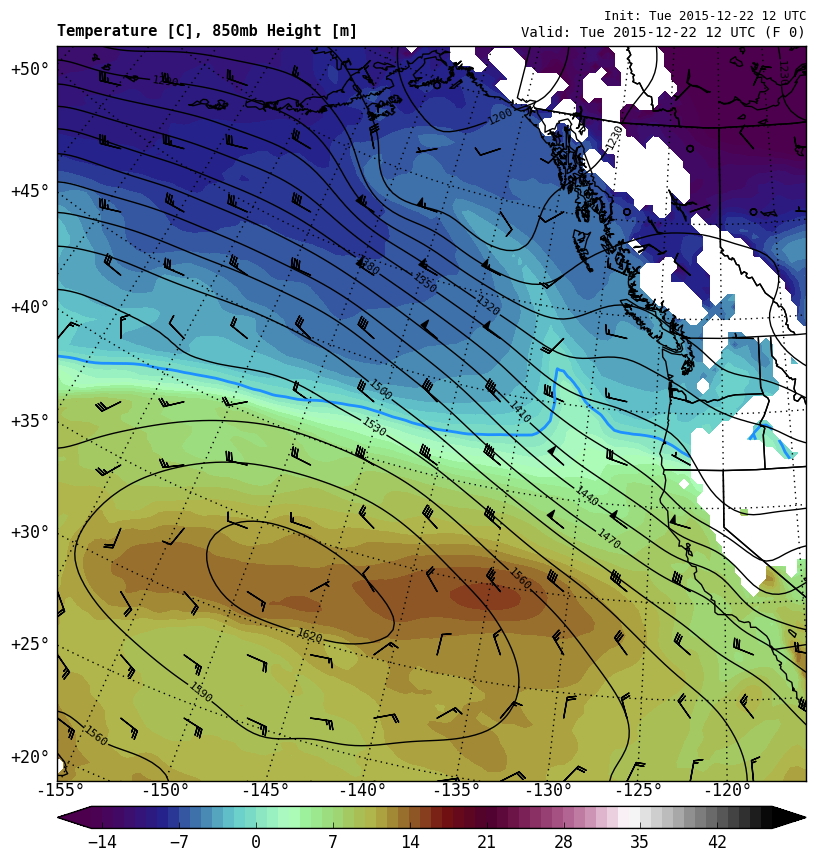
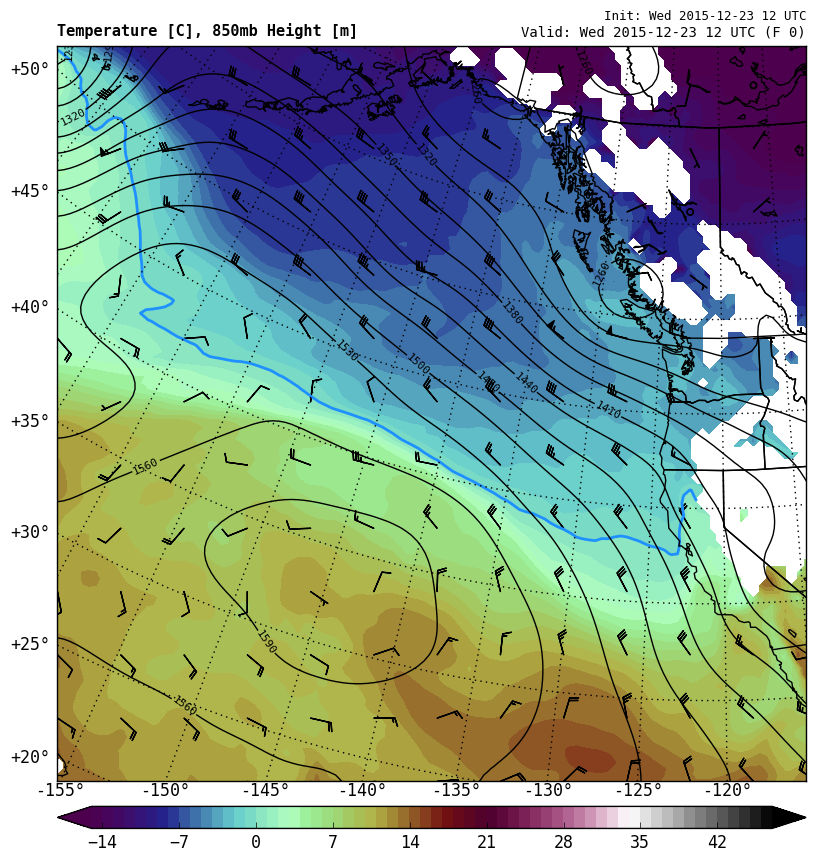
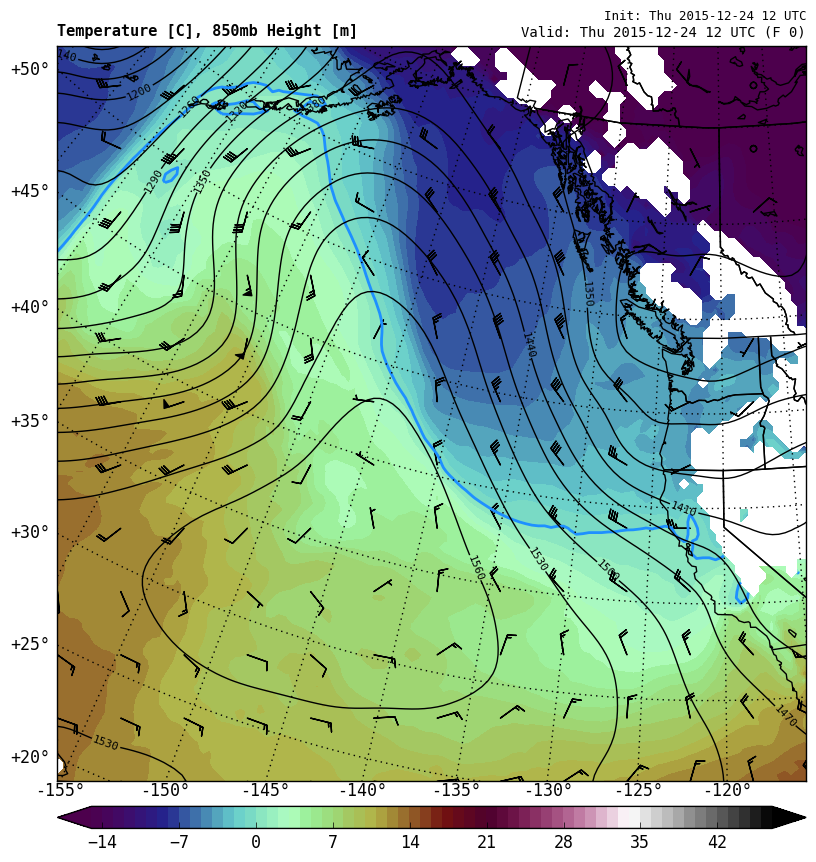
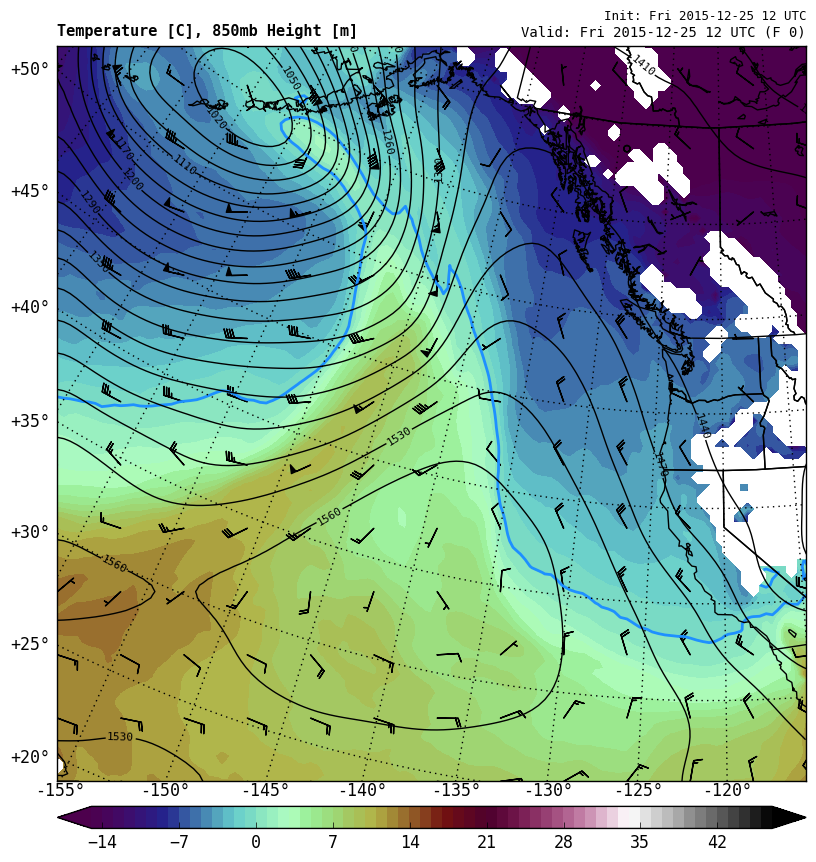
The 850 hPa temperature sequence is plotted in Figure 4. An occluded front was
positioned directly over the Washington coast at 1200
UTC 20-December. On 21-December, a 500 hPa perturbation
was associated with a developing surface low (near the
850 hPa trough). The second occluded front was offshore
on 22-December. The 850 hPa temperatures continued to
get colder behind each front. Some of the coldest air of
the season was offshore by 23-December.
The five satellite images in Figure
5 are associated with the most interesting periods
of precipitation. Figure 6
contains the most interesting LGX radar images. At 0600
UTC 20-December (first panel Figure
5 and Figure 6), a front
was approaching the coast with prefrontal precipitation
beginning over the peninsula. The LGX radar showed the
front reaching the coast around 1100 UTC (second panel Figure 6). The frontal boundary
was well defined and featured some embedded weak
convective cells. The cells resembled a narrow cold
frontal rainband (NCFR), but it was not as well defined
as previous cases in OLYMPEX. Postfrontal convection was
relatively weak and isolated. Starting around 0600 UTC
21-December, moisture and/or convergence associated with
the next wave appeared to enhance the postfrontal
precipitation. By 1000 UTC, stratiform prefrontal
precipitation overrode the lingering postfrontal
showers. A 985 hPa surface low made landfall near the
mouth of the Columbia at 1900 UTC, with precipitation
briefly pausing around 2100 UTC before another
postfrontal period picked up. The precipitation
intensified starting around 1500 UTC (second panel Figure 5), with
enhanced banded features apparent on the LGX radar (third panel Figure 6). The
heaviest rain around Lake Quinault fell between 1900 and
2000 UTC 21-December as the main precipitation band
pivoted from an west-east to southwest-northeast
orientation (fourth panel Figure 6).
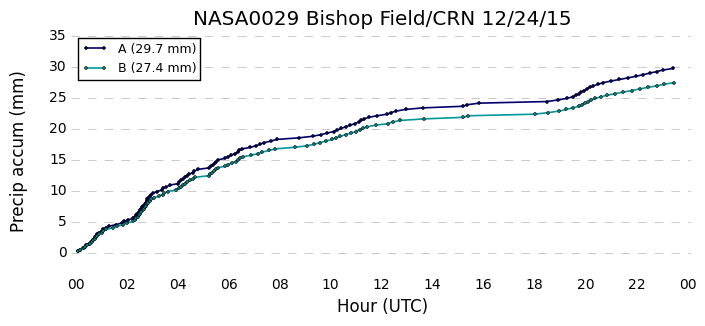
The uptick in rain rate is evident at the Bishop/CRN
site in the second row of Figure 7.
Postfrontal precipitation took over again just after
0000 UTC 22-December and continued through most of the
day. An occluded front passed between 2100 and 2300 UTC
(third panel Figure 5, fifth panel Figure 6). The front
was followed by a weak surface low which moved from west
to east across the northern part of the peninsula from
0200-0500 UTC 23-December. The low can be seen on LGX
radar just to the north of Forks at 0300 UTC (sixth panel Figure 6). The fourth and fifth panels of Figure 5
show the widespread postfrontal convection that began
around 0500 UTC 23-December and continued for about 36
hours through most of 24-December. Corresponding radar
images are the seventh and eighth
panels of Figure 6. The coverage and intensity of
the postfrontal precipitation was amazing. IR cloud tops
were consistently -40 to -50 C. Unfortunately there were
no soundings at Quillayute, but the 1200 UTC 23-Decmeber
analysis suggests that the 850 hPa temperatures were not
much colder than other postfrontal periods (-3 to -5 C).
However, it was very cold in the mid levels: -14 C at
700 hPa and -33 C at 500 hPa. The result was some
mid-level instability that promoted the growth of deeper
postfrontal cells. Precipitation finally tapered off by
0000 UTC 25-December, although isolated showers lingered
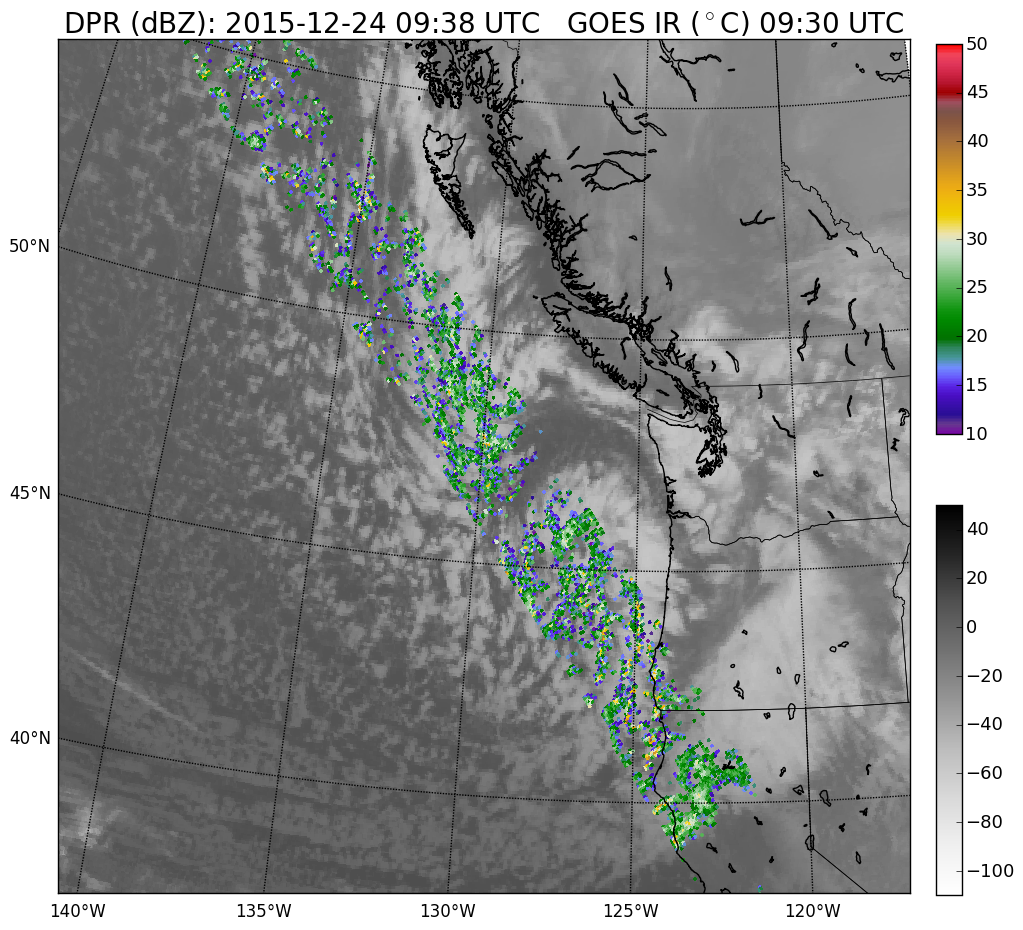
for another 24-36 hours. A GPM DPR overpass at 0938
24-December captured the widespread postfrontal
convection extending offshore from California to the
Gulf of Alaska (Figure 7).
The 24-h and 6-day precipitation totals totals for the
wet period are summarized in Table 1.
Amounts increased gradually from the coast to Lake
Quinault with 75-160 mm falling during the 6-day period.
The greatest orographic enhancement occurred during the
postfrontal period on 23-24 December. The Wynoochee
trailer recorded significantly more precipitation than
any other site, at least 210 mm and likely well over 250
mm based on estimates from the Parsivel. By 24-December,
the Pluvio bucket was overwhelmed by the combination of
heavy snow and cold temperatures.
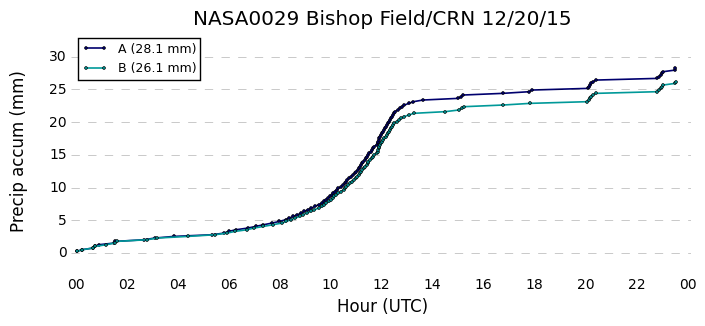
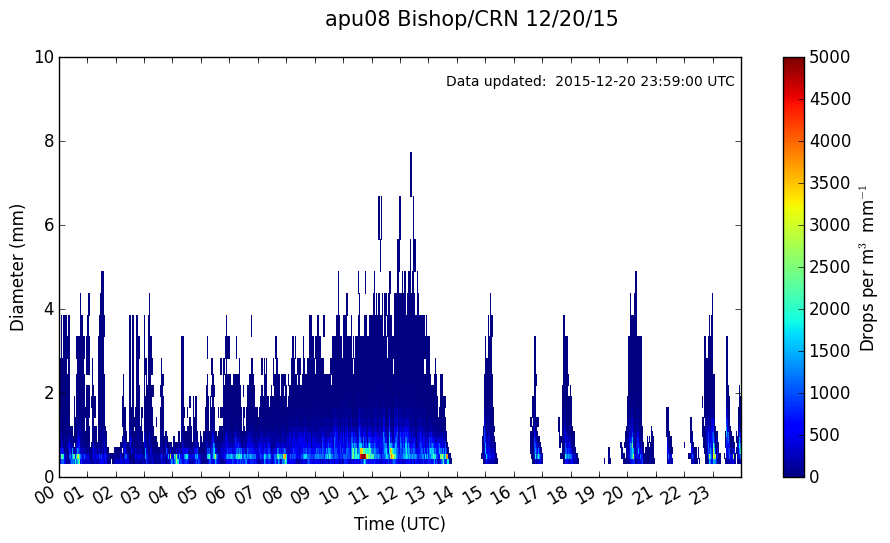
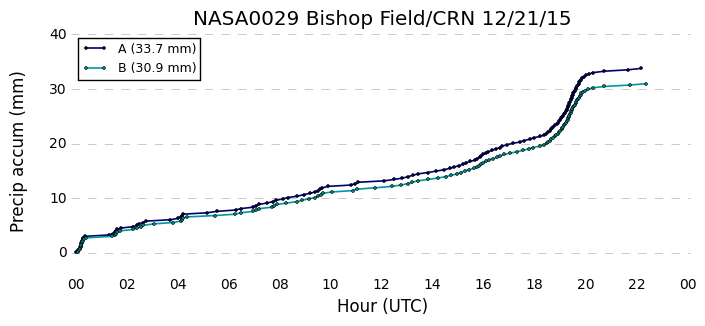
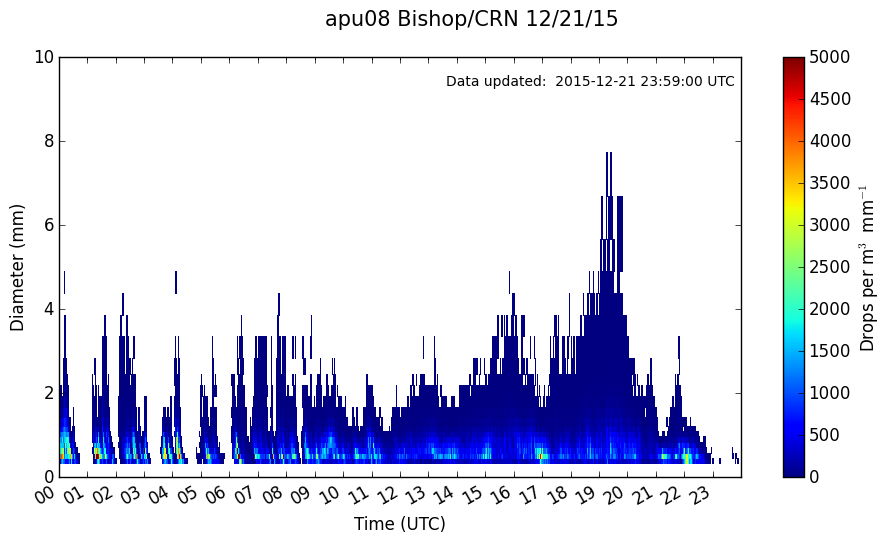
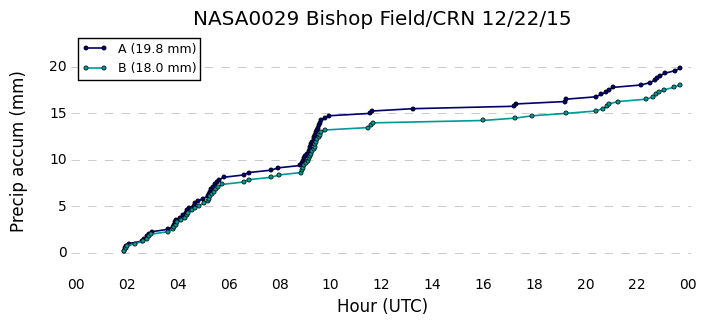
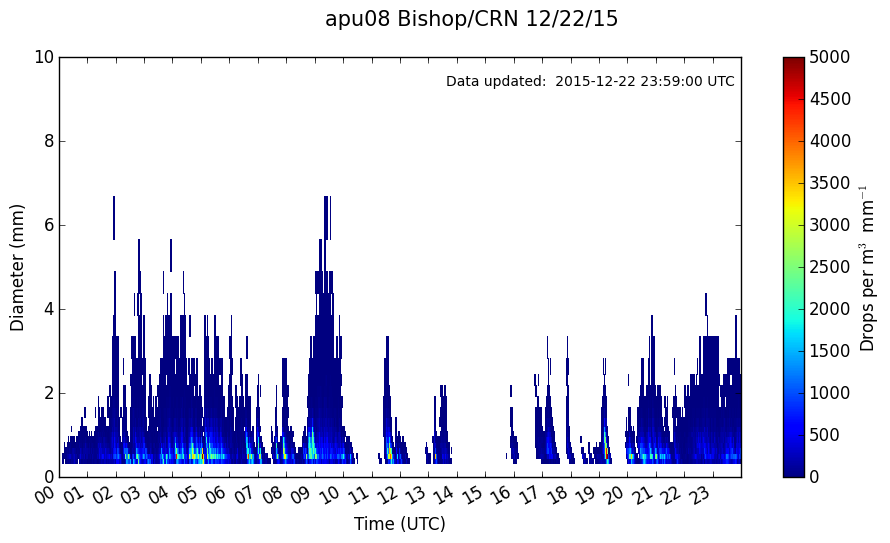
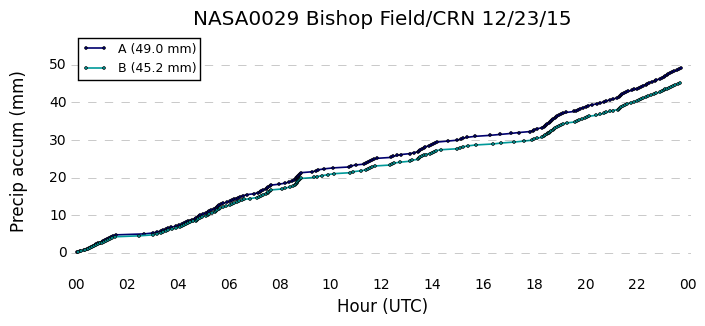
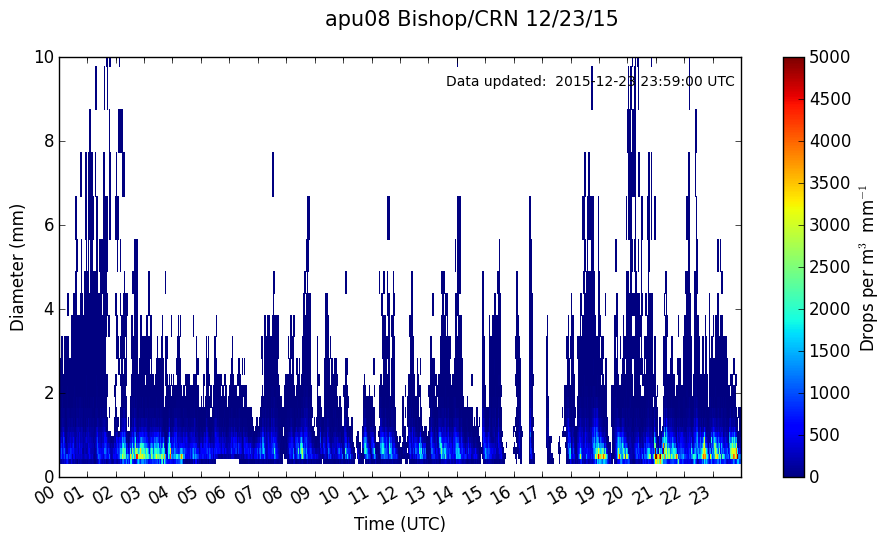
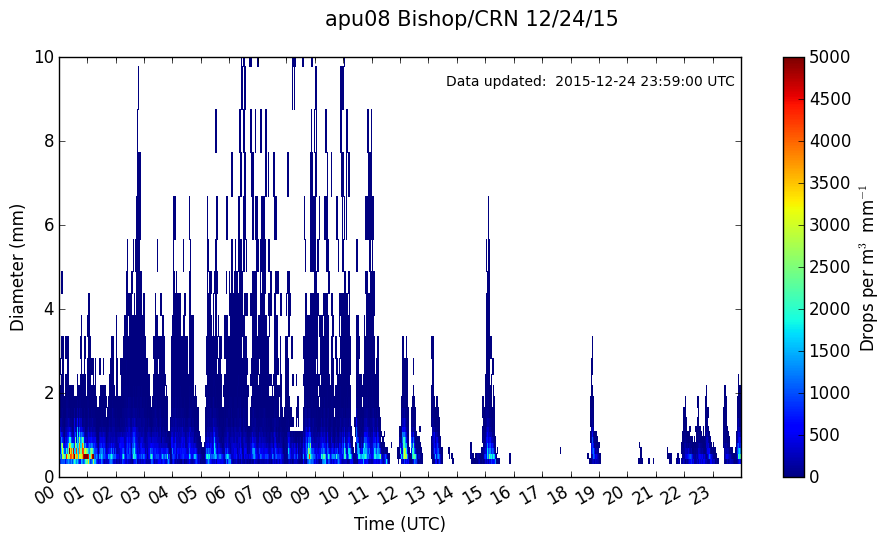
Parsivel data from the Bishop/CRN site is plotted
alongside the dual tipping bucket rainfall accumulation
in Figure 8. From 20-22
December, the precipitation was generally stratiform
with interspersed postfrontal periods matching the
timing of frontal passages described above. The intense
postfrontal regime on 23-24 December brought nearly
continuous precipitation. Snow was mixed in with the
rain at times, accounting for the larger particle sizes.
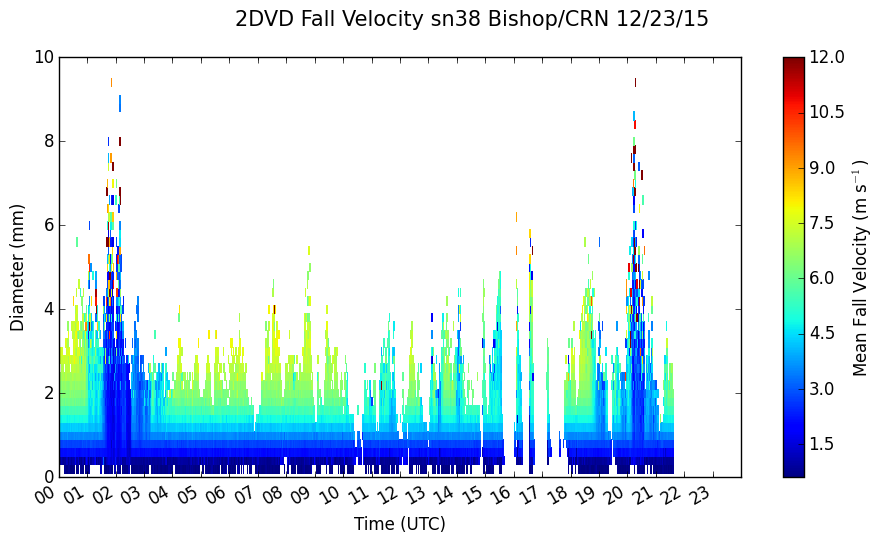
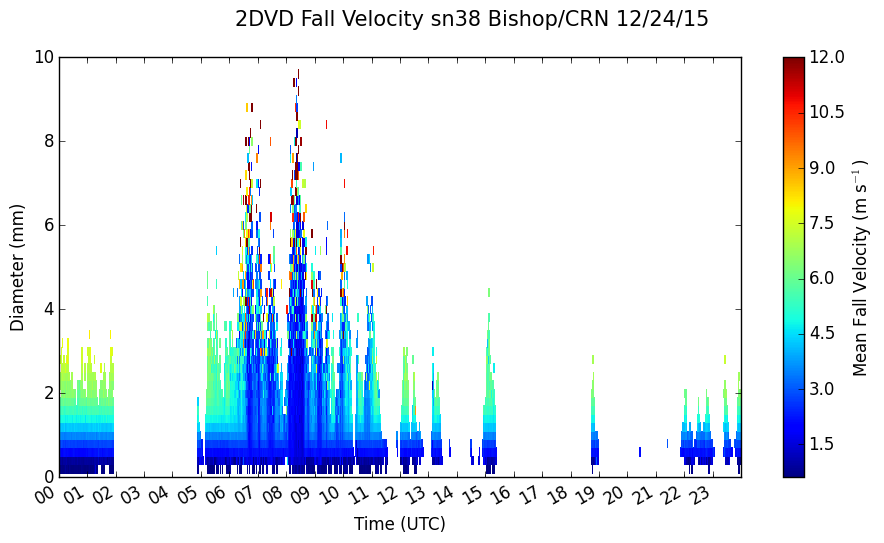
Figure 9 shows the 2DVD fall
velocity distribution at the Bishop/CRN site. The
periods of larger particles with slow fall velocities
correspond to mixed precipitation or snow. There is
missing data (power/instrument outage) after 2130 UTC
23-December and 0200-0500 UTC 24-December.
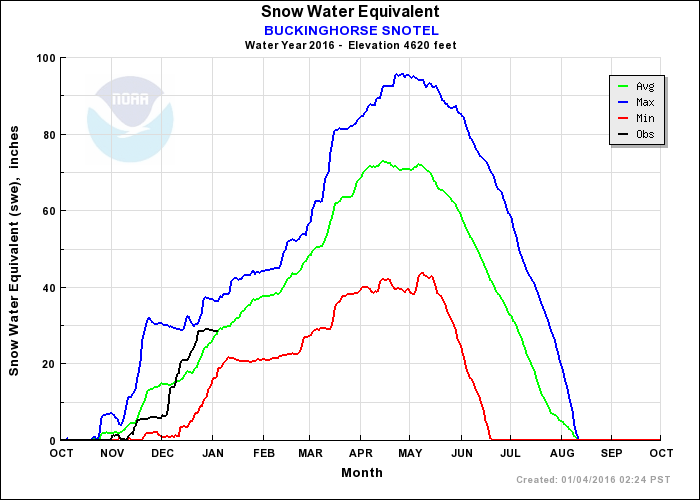
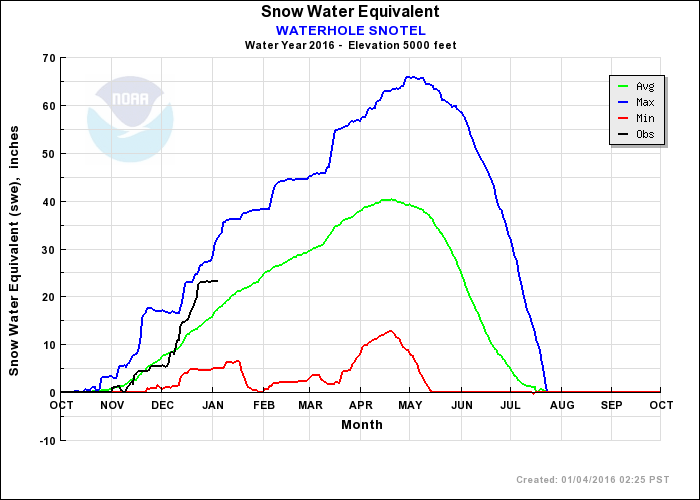
This series of weather systems was especially remarkable
for the snowfall accumulation at higher elevations. The
snow poles and Wynoochee trailer data will be available
at a later date, but for now the SNOTEL observations
show the impressive increase in snow depth. Buckinghorse
(4,800 ft near Enchanted Valley) reached 30 inches of
SWE. Waterhole (5,000 ft near Hurricane Ridge) reached
about 23 inches (Figure 10). At
the end of the month, Buckinghorse had near-normal SWE
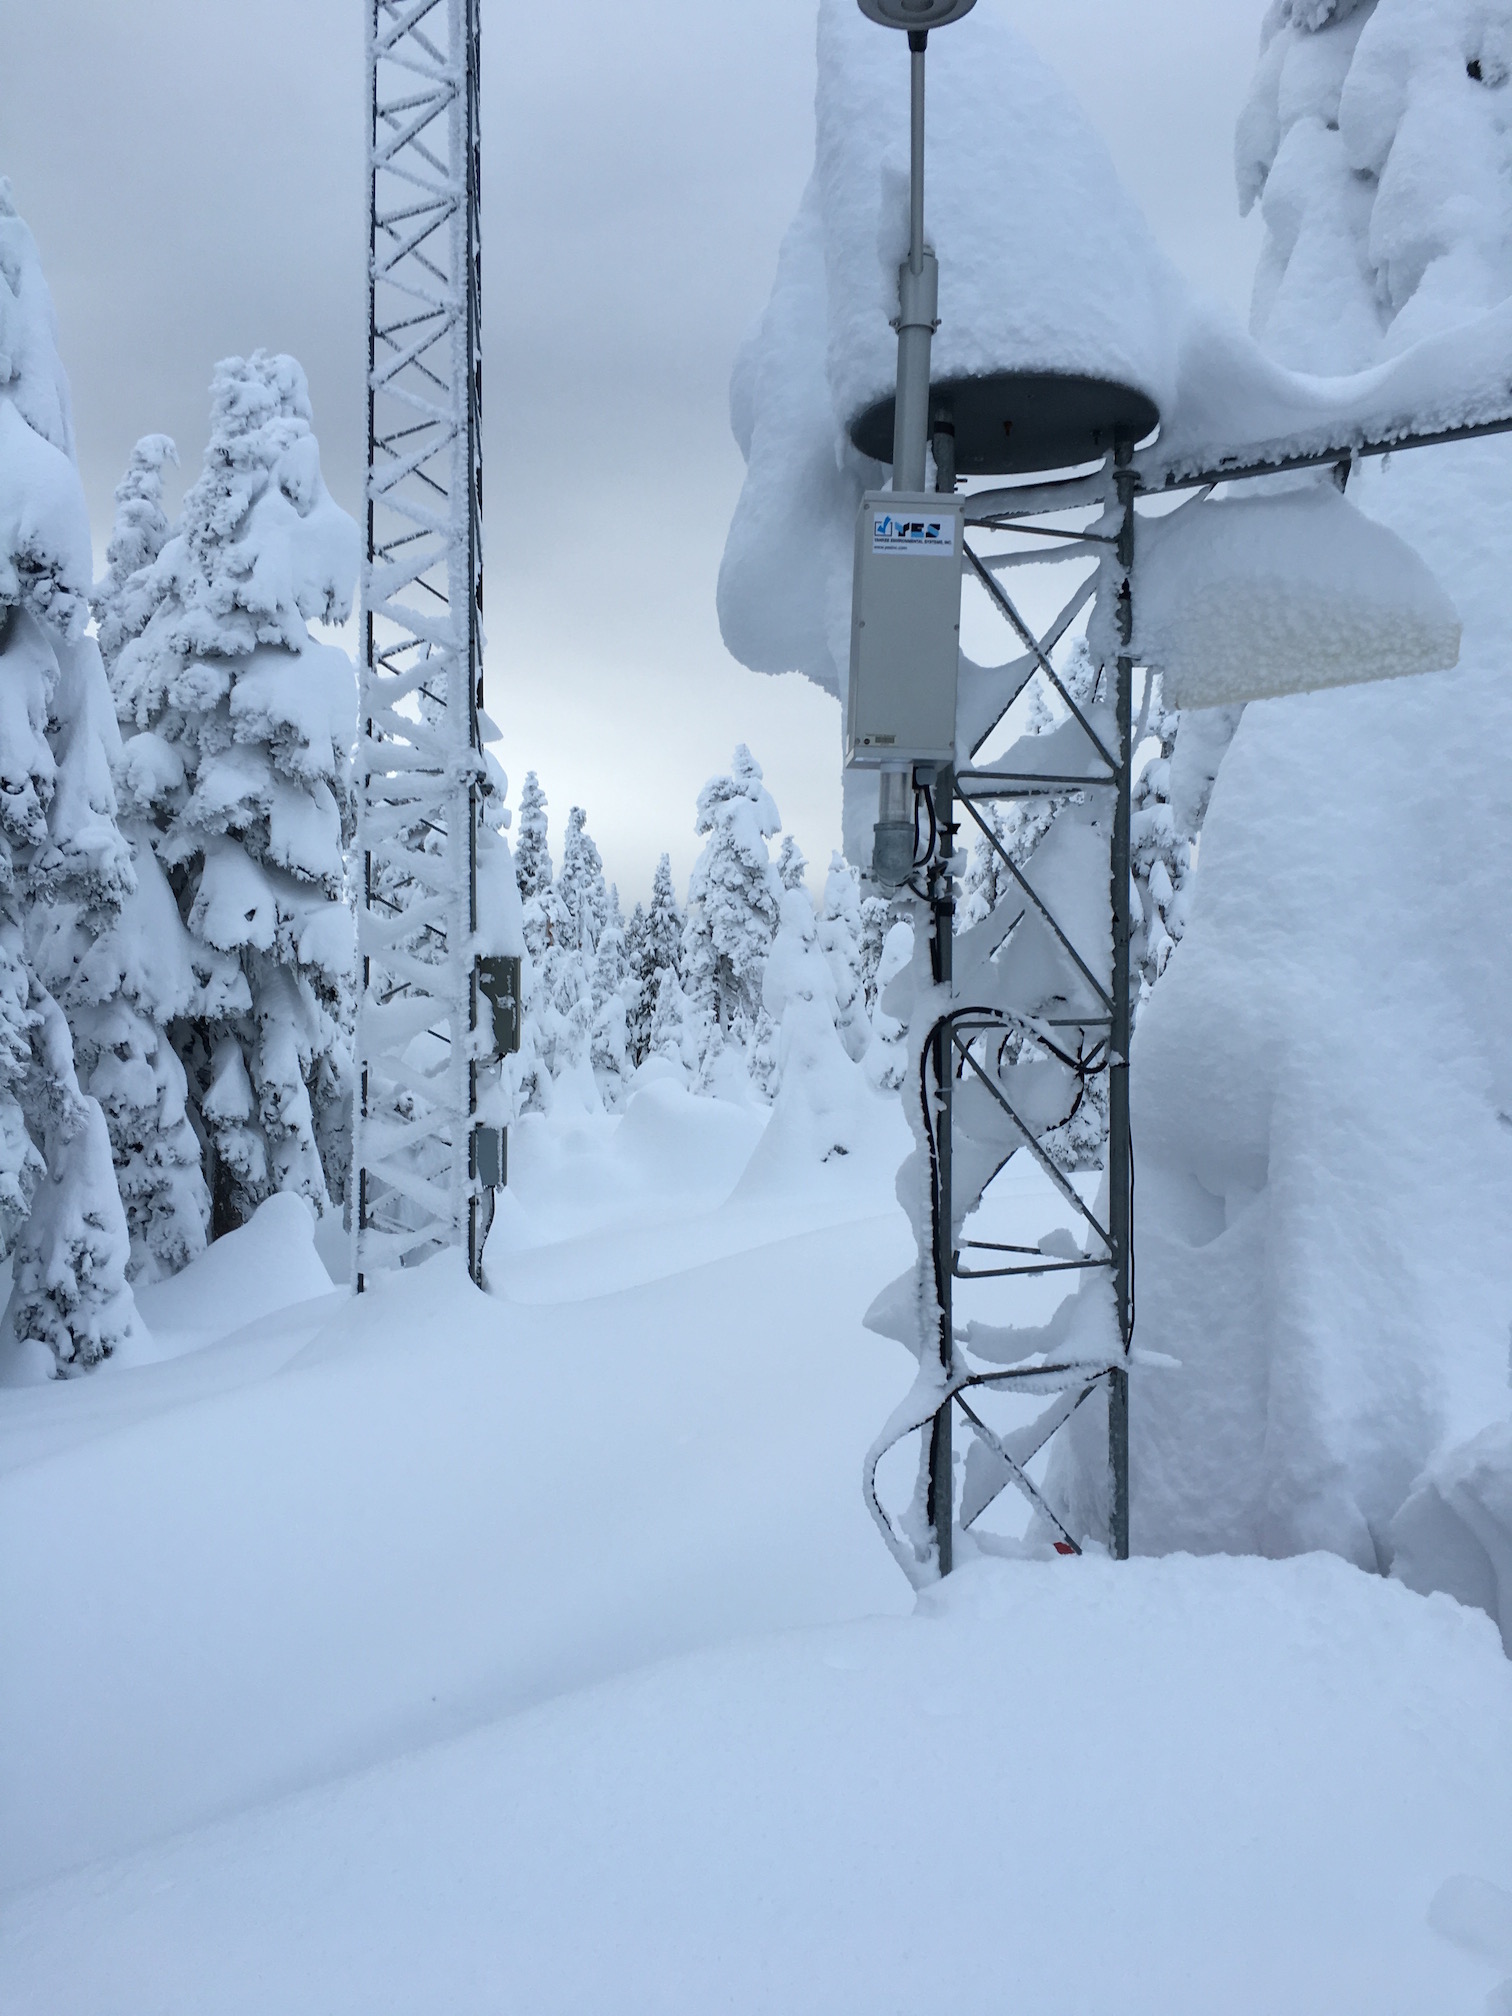
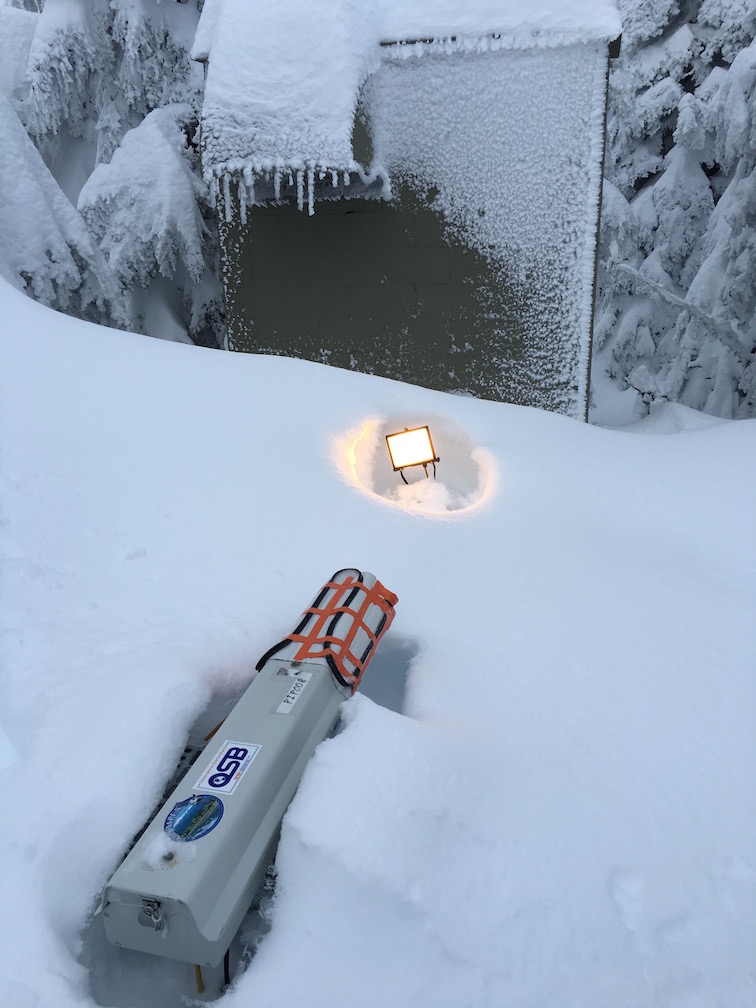
while Waterhole was well above normal. Photos from
Hurricane Ridge on 26-December (Figure
11) show the PIP buried in a snow drift. The right
photo looking out at the instrument towers was taken
from an ~8 ft rooftop. The snow drifted above this roof
in some places.
|