In our analysis of trends, we have presented changes in the mean temperature or precipitation based both on 30-year means and a linear fit. Somewhat different results are found for each method. For example, HADCM3 shows greater annual warming compared to CCSM3 if a linear fit is used than if 30-year means are used. In both cases, the relationship between warming in the A2 and B1 scenarios is similar across all models, with greater warming in A2 than B1. However, the linear fit method produces a greater disparity between the A2 and B1 scenarios than is seen for the 30-year means.

 Examining the
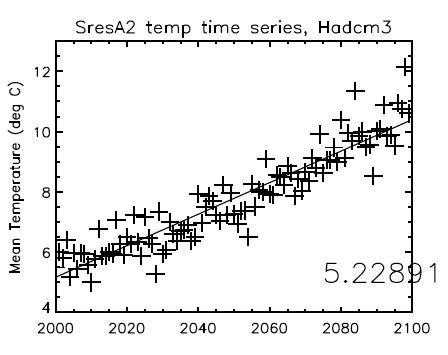
raw time series for HADCM3 for the A2 scenario shows that, for the A2
simulation, there is a distinct upward curvature to the warming time
series. The linear trend, therefore, overestimates the warming in the
middle of the century and underestimates it at the beginning and end
of the century. Thus, in this case, the 30-year means appear to better
capture the warming at mid century. Since the A2 scenario assumes an
exponential growth in greehouse forcing, this tendency to overestimate
mid-century warming will tend to be present, to various degrees, in
all 2040s estimates using the linear regression approach.
Examining the
raw time series for HADCM3 for the A2 scenario shows that, for the A2
simulation, there is a distinct upward curvature to the warming time
series. The linear trend, therefore, overestimates the warming in the
middle of the century and underestimates it at the beginning and end
of the century. Thus, in this case, the 30-year means appear to better
capture the warming at mid century. Since the A2 scenario assumes an
exponential growth in greehouse forcing, this tendency to overestimate
mid-century warming will tend to be present, to various degrees, in
all 2040s estimates using the linear regression approach.
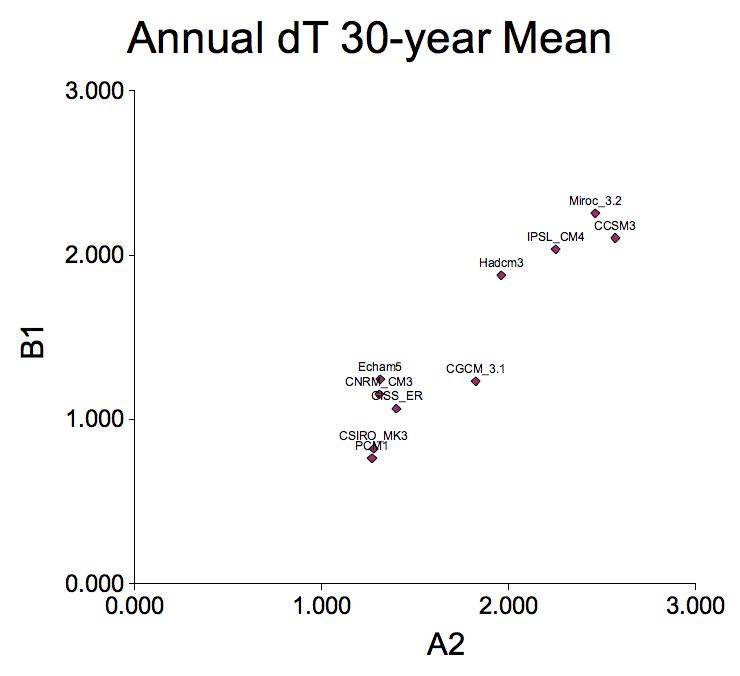
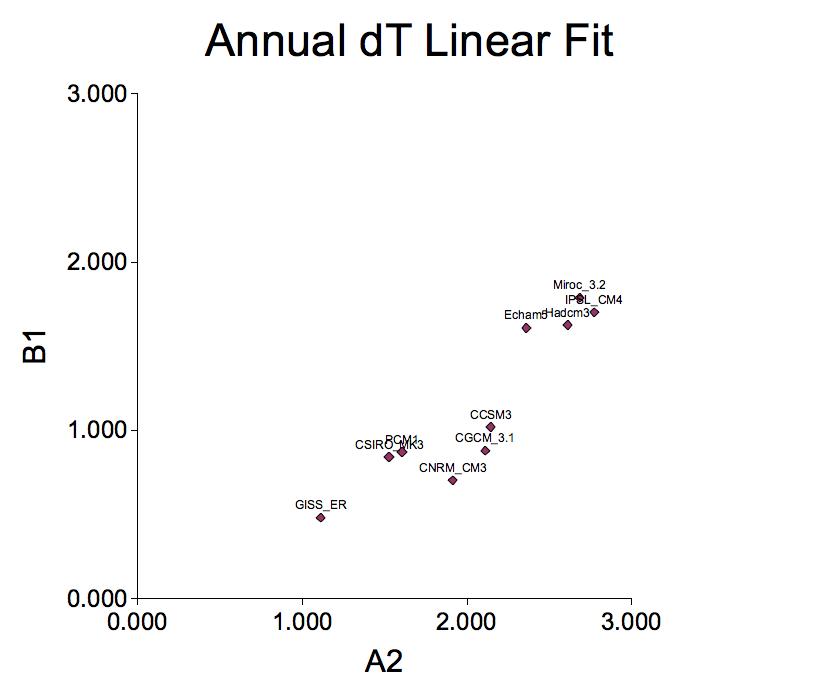
If we consider the simulation of two emissions scenarios (A2, B1) for a given model, the anthropogenic trend in the two simulations should differ in a predictable way depending on the magnitude of the greenhouse forcing. This difference should be consistent among all models. Thus, if a method for assessing trends is successful in isolating the anthropogenic component, a scatter plot of changes in the A2 versus the B1 scenario should have all points along a line.
Below are plots of regional mean DJF temperature changes for 2045 relative to 2000 for the A2 and B1 scenario. In Fig 1, the 30-year centered mean is used to assess changes while in Fig 2, the linear trend is used. For either method, the A2 and B1 results are highly correlated among the models. For the 30-year mean method, the linear fit shows much greater warming for the A2 scenario than for the B1 scenario.