The table below shows the difference between the 20th Century climate simulated by each model and the VIC driving data for DJF and JJA. In all cases, we use a 50-year (1949-1999) temporal mean and a PNW spatial mean (the Columbia basin plus west side of Cascades). For consistency, the model data grid is sampled at the 1/8 degreee resolution of the VIC data and spatially averaged over the points where VIC data is available.
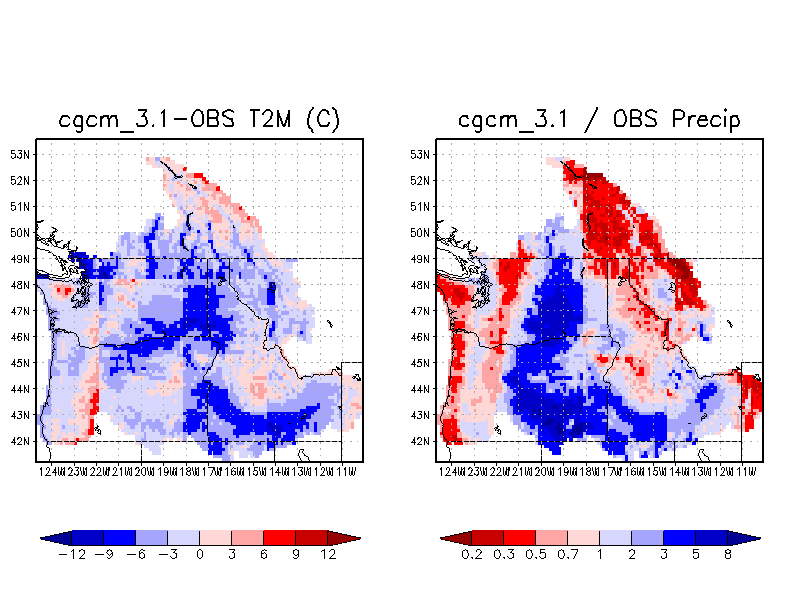
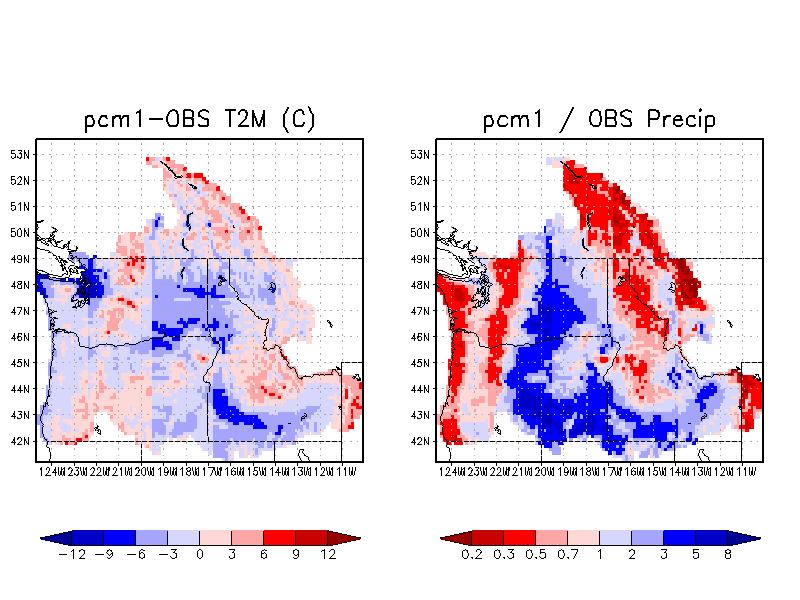
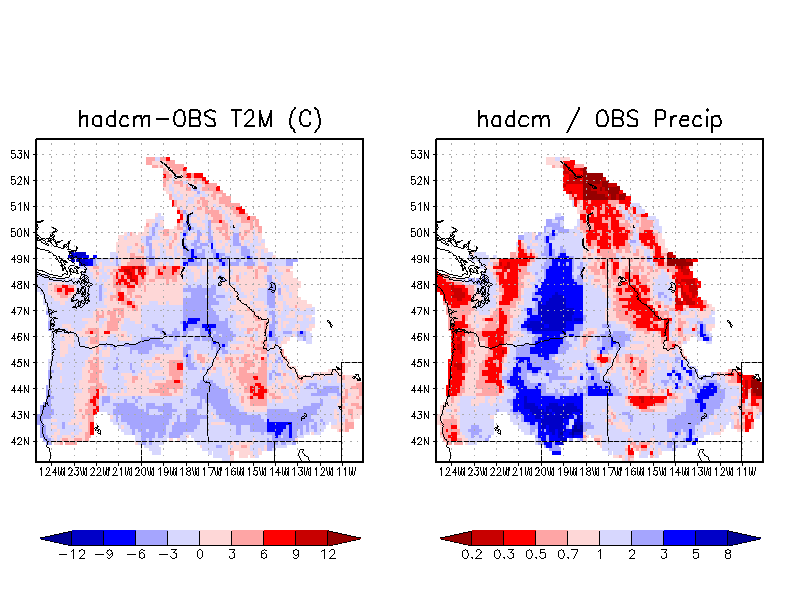
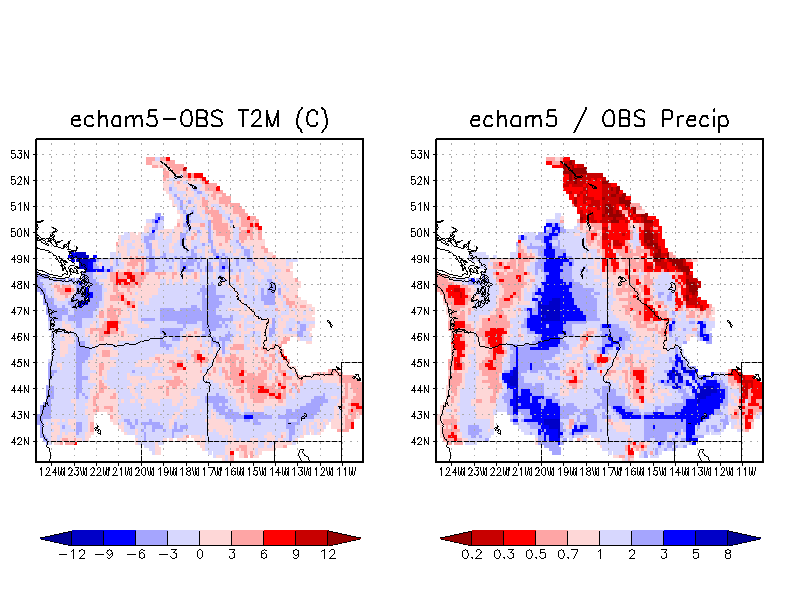
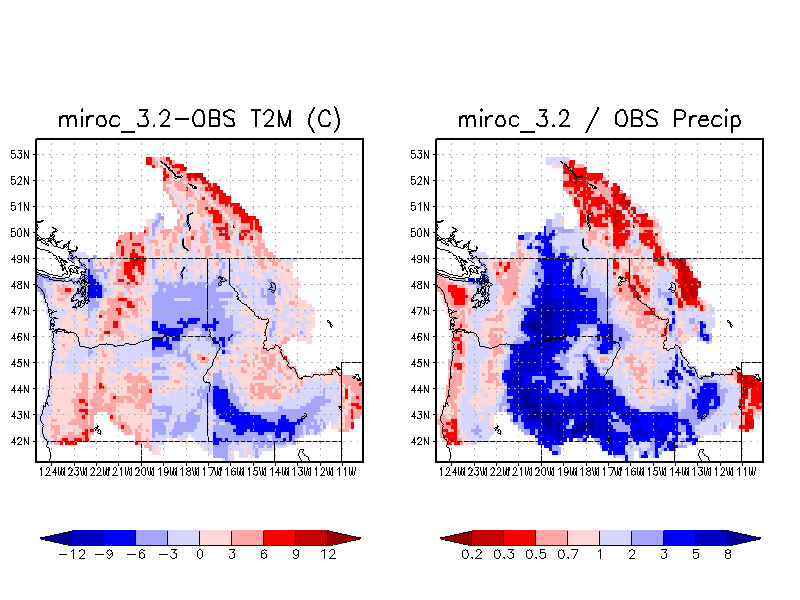
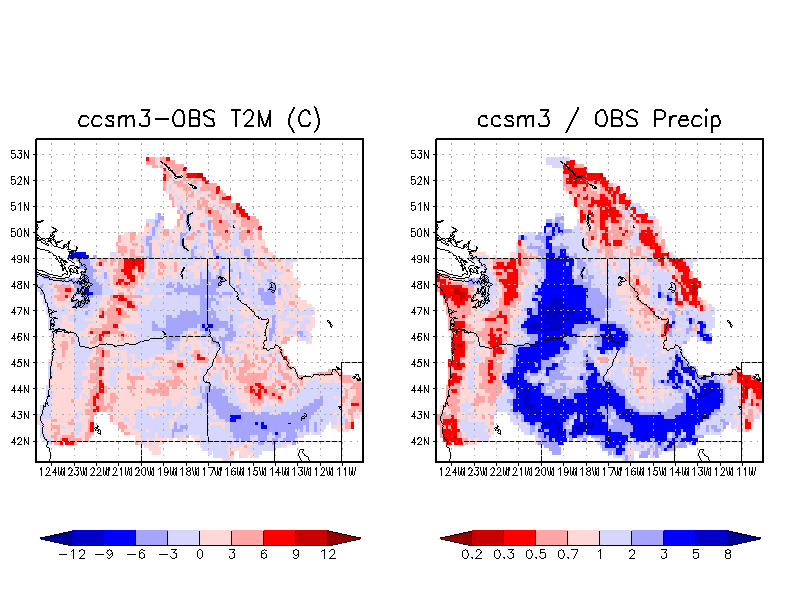
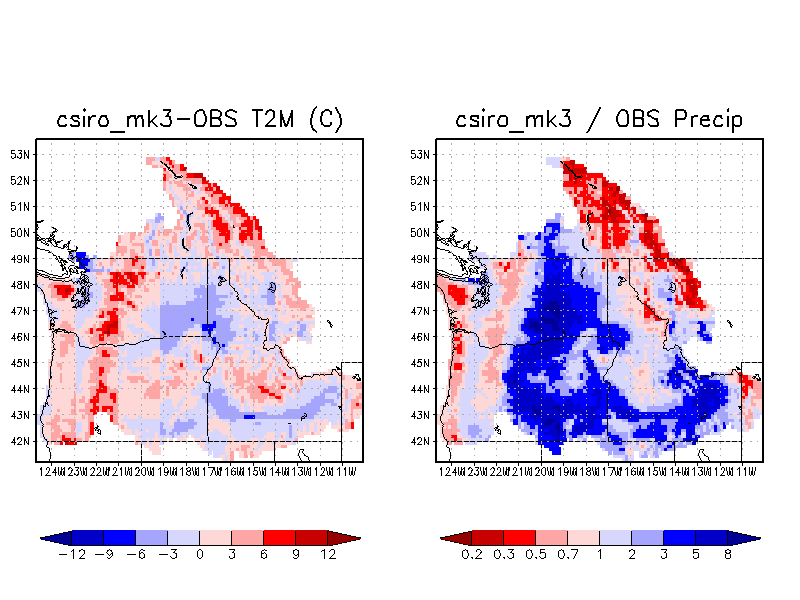
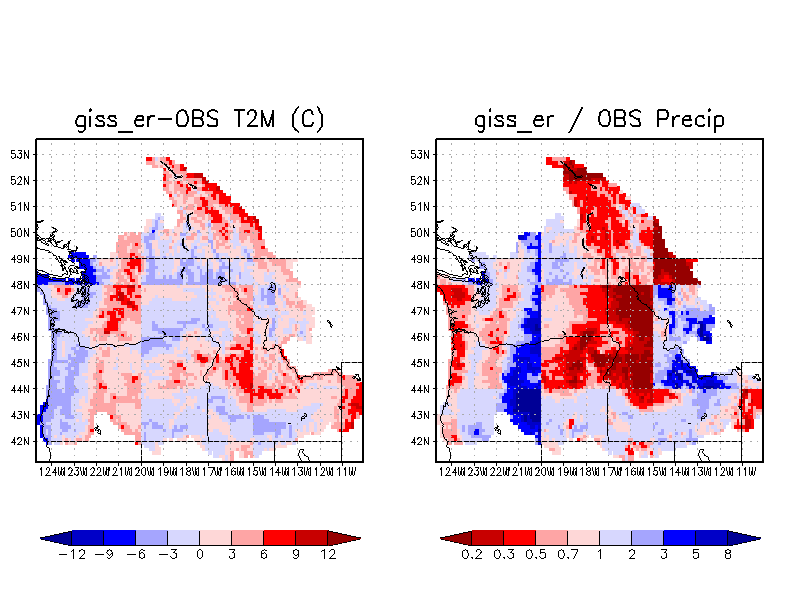
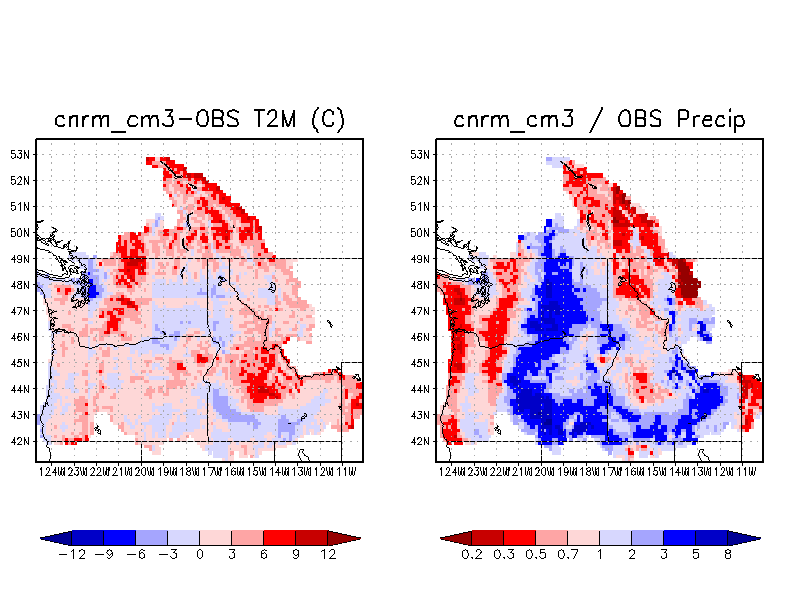
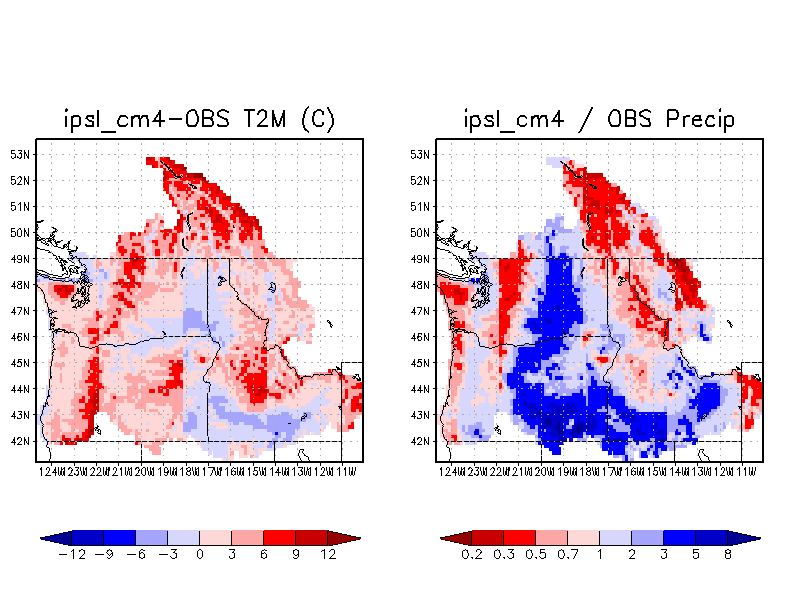
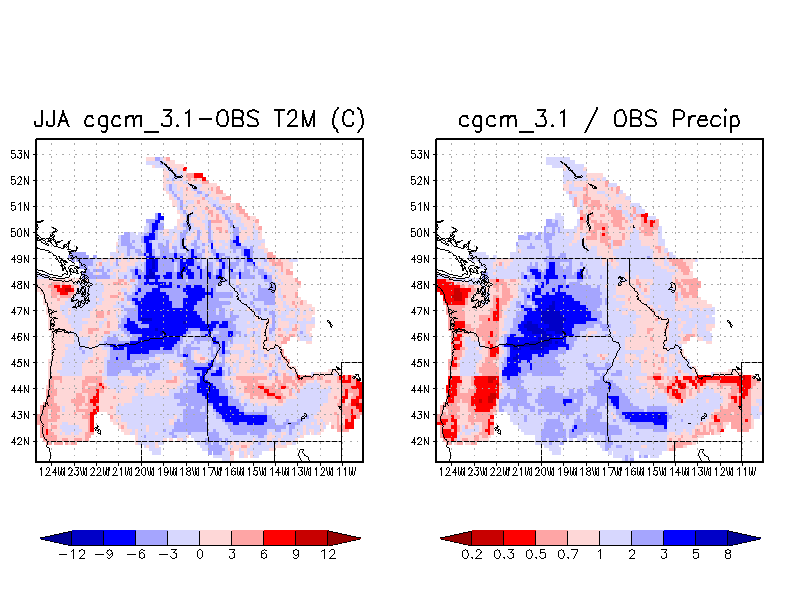
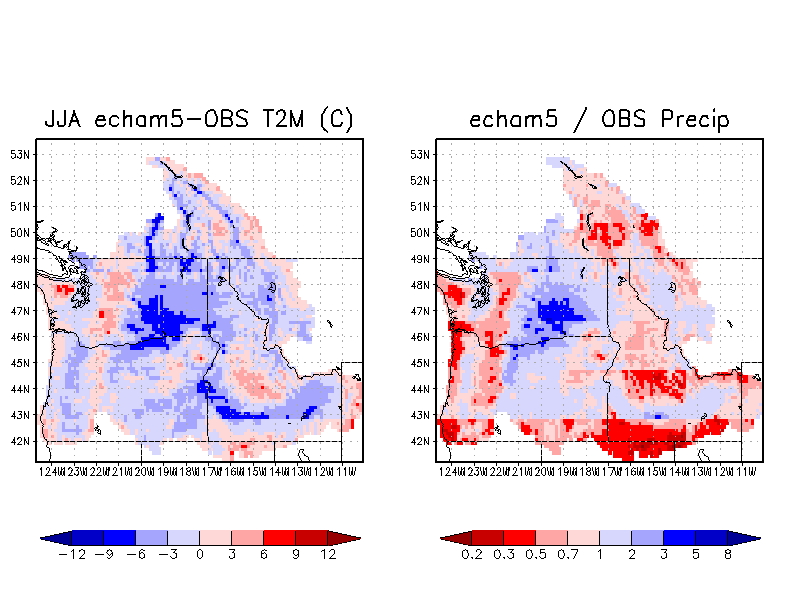
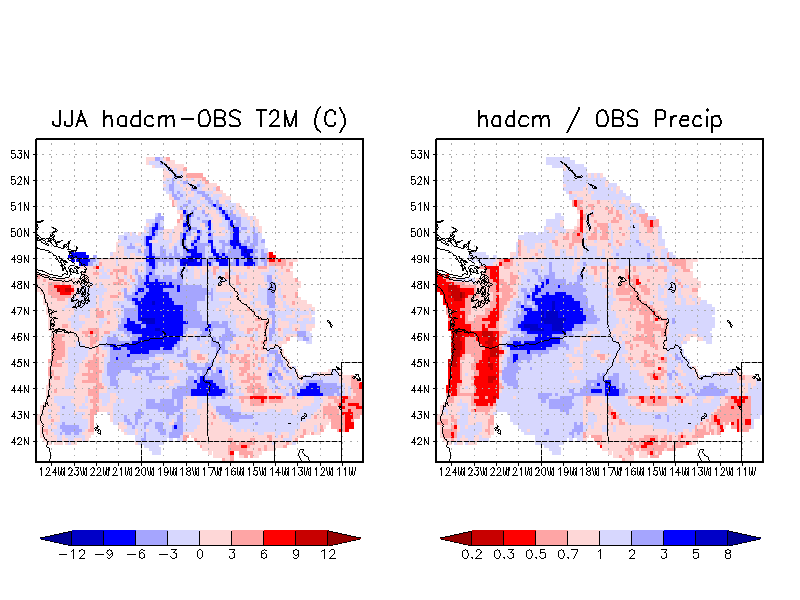
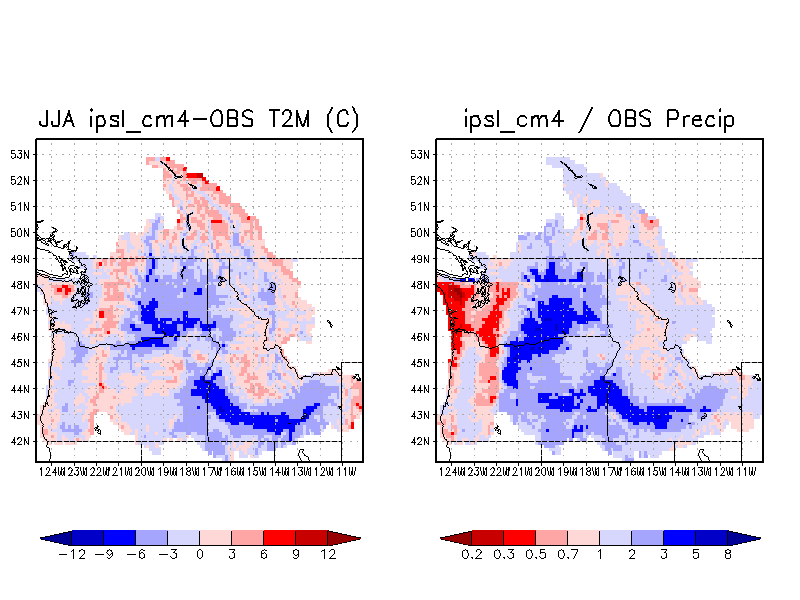
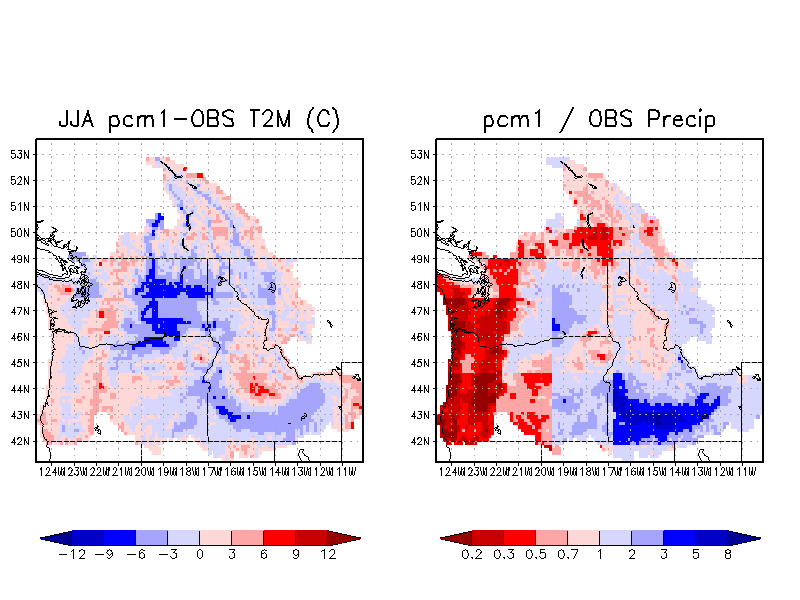
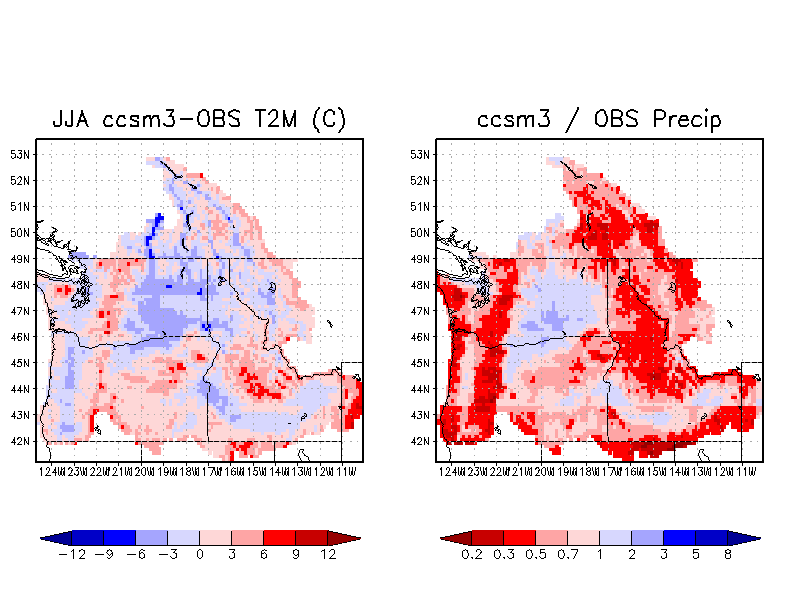
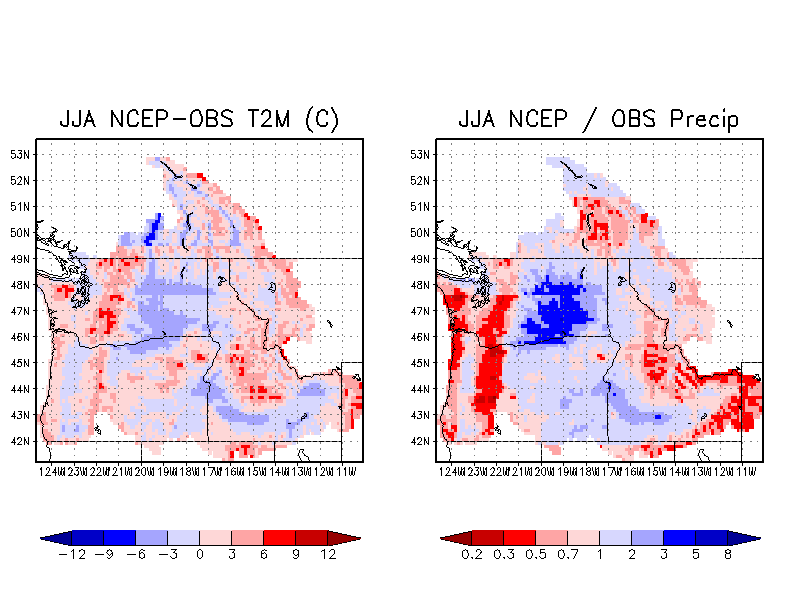
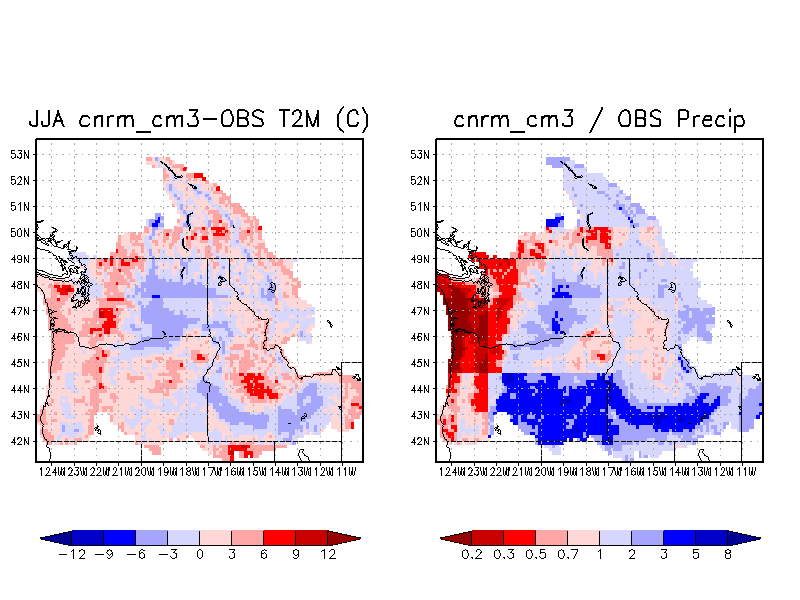
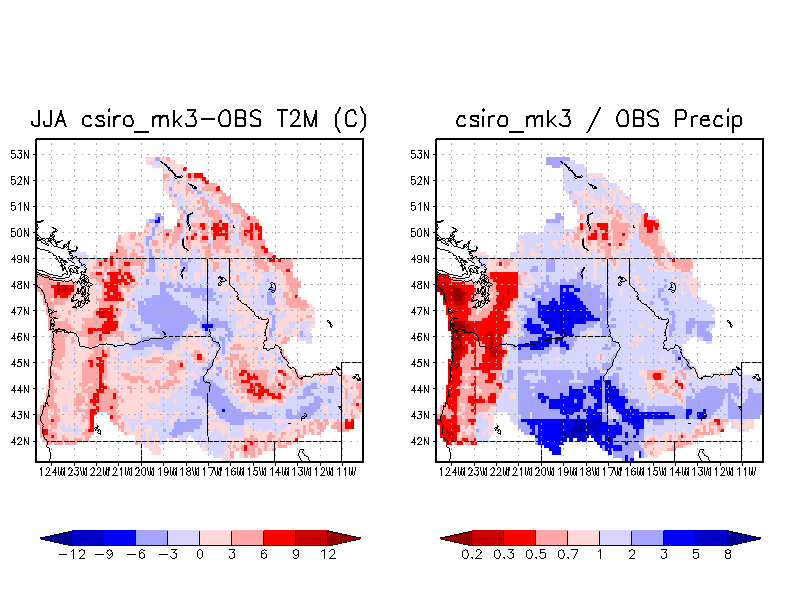
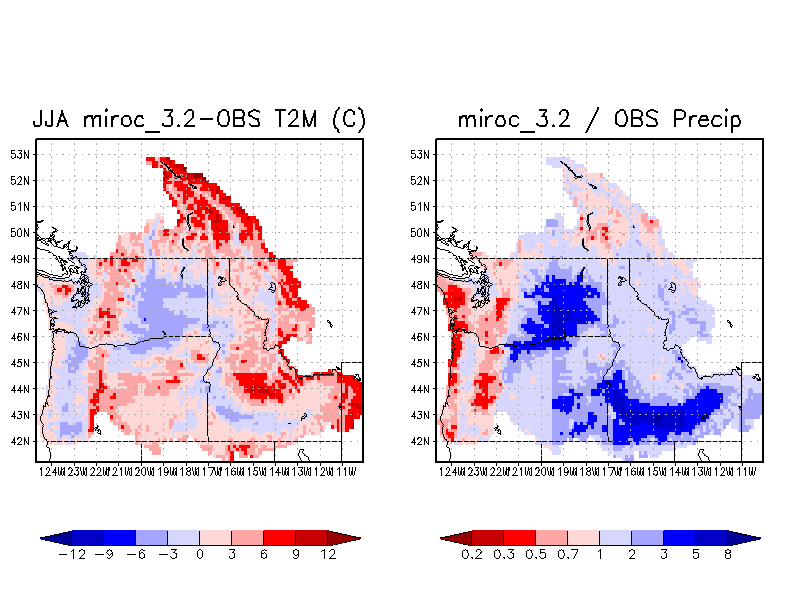
The first column shows the model. Clicking on the model name will show a plot of the spatial pattern of the difference fields. In the figures, temperature is on the left (blue indicates the model is too cold, red too warm). Precip is on the right (blue indicates model too wet, red too dry).
The second column shows the difference between model and VIC temperature (degrees C, negative means model is too cold); the third is the ratio of model and VIC precipitation (less than one indicates model is too dry). The models have been sorted by the temperature difference.
For DJF, hadcm, echam5 show the smallest temperature bias. pcm1, miroc and ccsm are close behind. The remainder show large biases, especially in precipitation. Generally, there is a correspondence between temperature and precip biases, suggesting the biases reveal underlying dynamical deficiencies.
For JJA, the relative performance of models is very different. Temperature biases tend to be larger (althogh some models have smaller JJA biases than DJF). However, the better models for DJF generally show reasonable biases for JJA.
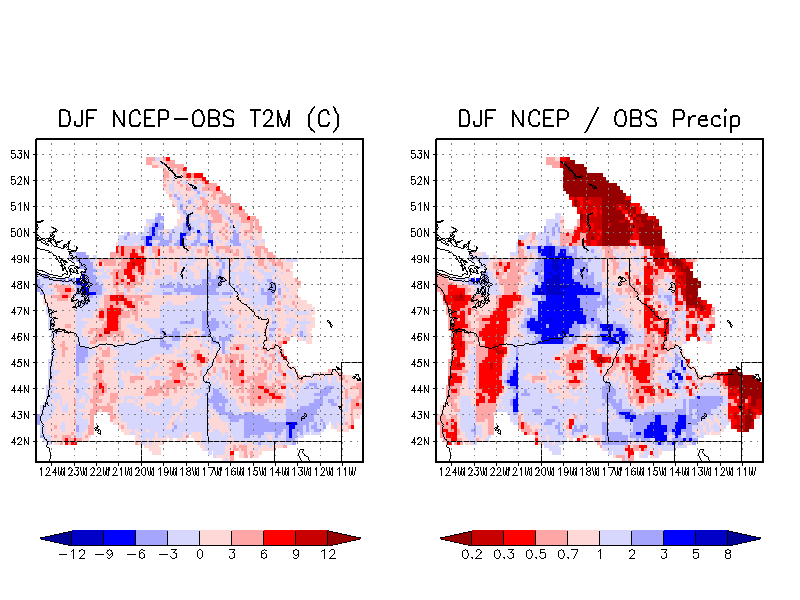
For comparison, similar results for the NCAR-NCEP Reanalysis grids is also presented. The NCEP surface temperature shows a warm bias, which is attributable to coarse representation of topography. Since the models do not resolve the regional topography, surface temperatures will unavoidably reflect the difference in the model and actual topography. The models do not represent the Cascade and Coastal Ranges, and thus reflect a lower elevation over the region, which results in a warm bias.
|
| ||||||||||||||||||||||||||||||||||||||||||||||||||||||||||||||||||||||||||||||