On this page, an initial comparison of observations from EPIC-ITCZ are compared with cloud resolving model simulations using the System for Atmospheric Modeling (SAM). The SAM simulations are forced by the single column forcings supplied on the EPIC ITCZ Integrated Dataset webpage. Please note that these results are preliminary and only intended as an initial validation of the EPIC ITCZ single column forcings. They should not be further disseminated or referenced in presentations or publications until we have more time to evaluate and understand the forcings and the model's performance more completely.
Two simulations of EPIC ITCZ using SAM are presented here. These use two different microphysical schemes: (1) SAM's default one-moment bulk microphysics scheme that uses a temperature-based relationsip to diagnose the phase of clouds and precipitation and (2) a two-moment bulk microphysics scheme developed by Hugh Morrison and collaborators that has prognostic equations for water vapor, cloud water, cloud ice, graupel, snow and rain. The Morrison scheme is a port of his WRF microphysical scheme module_mp_graupel.F to SAM. The observations and simulation results are identified in the plots and table below using the following tags:
| Run | OBS | SAM | MOR |
|---|---|---|---|
| prec [mm/d] | 18.06 | 18.55 | 18.43 |
| shd cld frac | 0.87 | 0.52 | 0.68 |
| pw [mm] | 58.82 | 63.98 | 66.15 |
| cwp [um] | N/A | 131.36 | 87.20 |
| iwp [um] | N/A | 112.60 | 40.94 |
| swp [um] | N/A | 61.63 | 190.20 |
| gwp [um] | N/A | 82.72 | 109.51 |
| rwp [um] | N/A | 167.50 | 193.57 |
| sst [K] | 302.33 | 302.33 | 302.33 |
| lhf [W/m2] | 125.26 | 133.71 | 123.64 |
| shf [W/m2] | 18.41 | 16.04 | 13.84 |
| swcrf [W/m2] | -117.19 | -93.06 | -103.05 |
| lwcrf [W/m2] | 71.90 | 52.12 | 91.42 |
| olr [W/m2] | 204.06 | 217.75 | 176.78 |
| albedo | 0.37 | 0.29 | 0.32 |
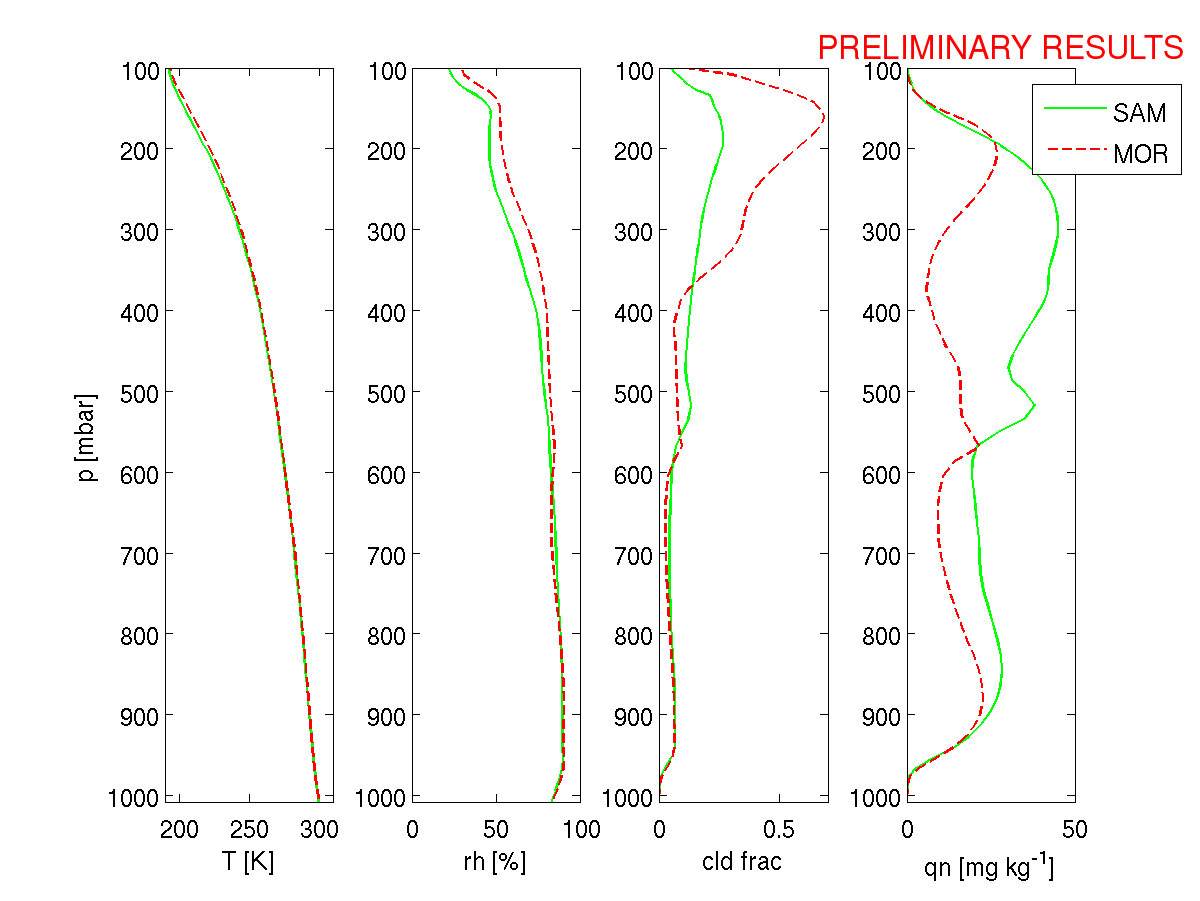
The models are constrained by the forcings to produce precipitation that is similar to the radar-derived precipitation estimate, as this estimate is a dominant term in the diagnostic dry static energy budget used to construct the forcings. The models have a smaller cloud amount than is found in the ISCCP observations. While SAM has weaker short- and longwave cloud forcing than the ISCCP observations, MOR has a stronger longwave cloud forcing and weaker shortwave than ISCCP. Note here that the ISCCP observations are a weighted average of three ISCCP equal area pixels that cover a much larger area than the radar that was used to estimate precipitation. The difference in longwave cloud forcing between SAM and MOR could result in part from a relative lack of anvil cloud in SAM (Lopez et al 2008).

Note that the greater amount of high cloud in the MOR run seems to lead to a greater warming of the upper troposphere in that run relative to the observations. Also, the moist bias in the simulations may be in part due to the relatively small (100 km square) horizontal domain (see e.g. Blossey et al 2007).
The vertically-integrated energy and moisture in the simulations gradually become warmer and moisted than the radiosonde observations.
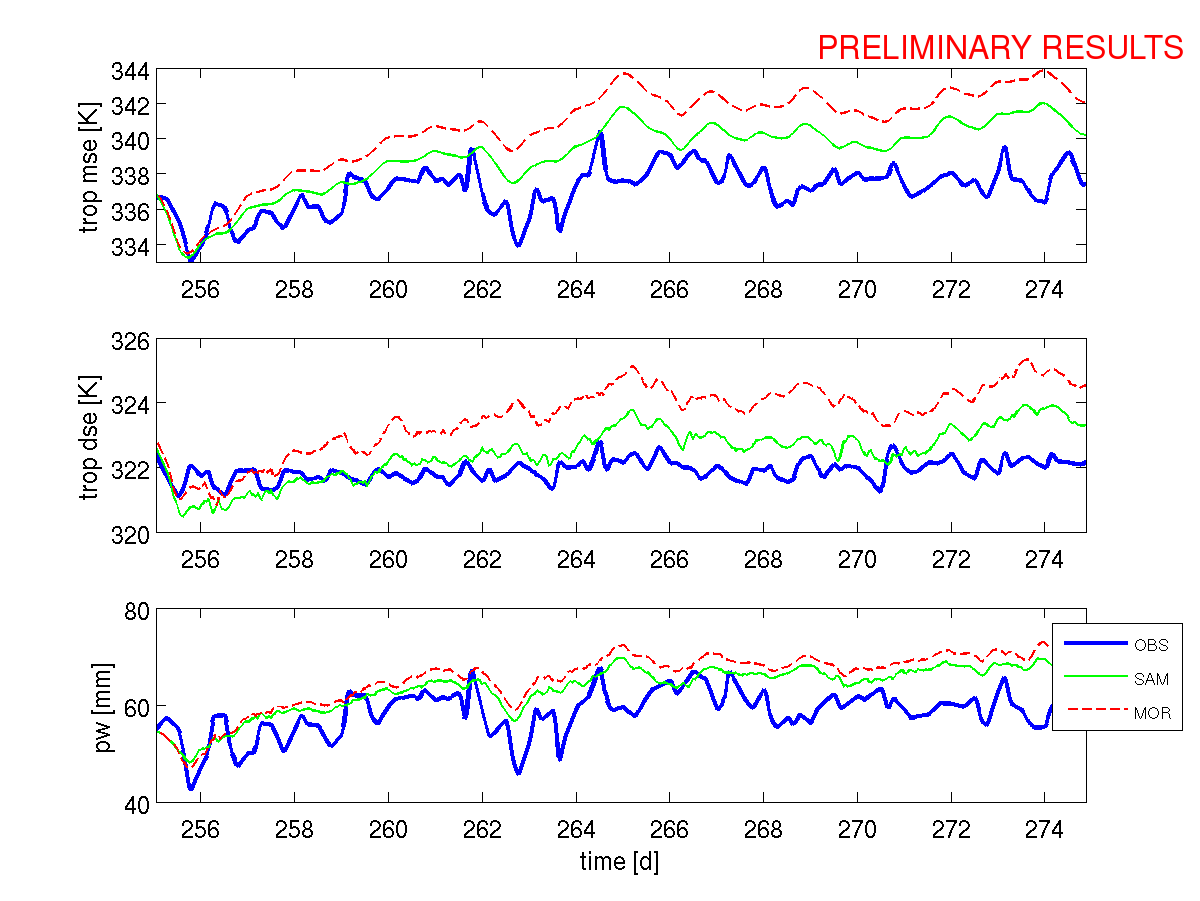
Note that the greater amount of high cloud in the MOR run seems to lead to a greater warming of the upper troposphere in that run relative to the observations.

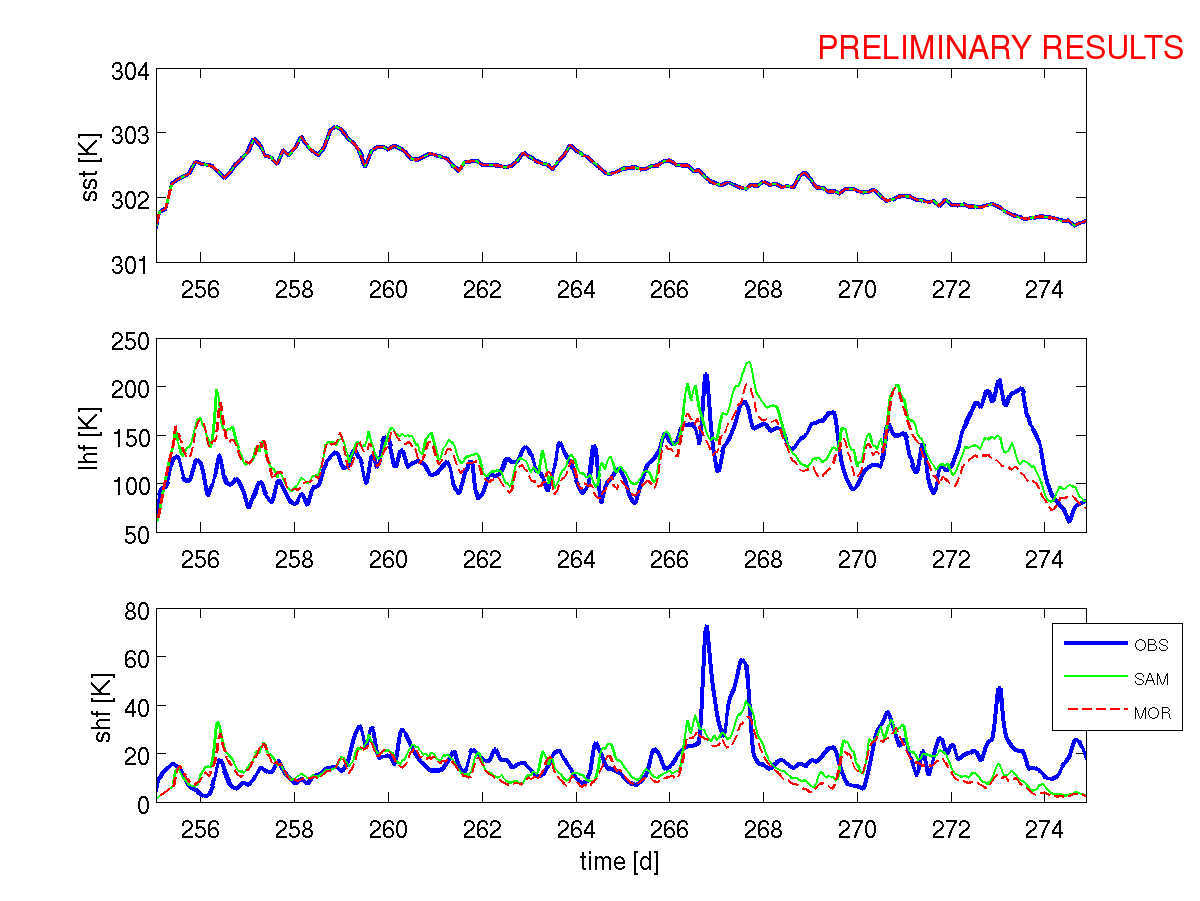
Except for over the last couple of days, there appears to be little bias in the simulations at the surface.

Note that qn below refers to the mixing ratio of cloud condensate, including both water and ice. Apparently, MOR produces a greater longwave cloud forcing with a greater cloud amount of thinner ice clouds.