

| Wavelet Toolbox | |
Continuous 1-D wavelet coefficients.
Syntax
COEFS = cwt(S,SCALES,'wname') COEFS = cwt(S,SCALES,'wname','plot')COEFS = cwt(S,SCALES,'wname',PLOTMODE)COEFS = cwt(S,SCALES,'wname',PLOTMODE,XLIM)
Description
cwt is a one-dimensional wavelet analysis function.
COEFS = cwt(S,SCALES,'wname') computes the continuous wavelet coefficients of the vector S at real, positive SCALES, using the wavelet whose name is 'wname' (see waveinfo for more information).
The signal S is real, the wavelet can be real or complex.
COEFS = cwt(S,SCALES,'wname','plot') computes and, in addition, plots the continuous wavelet transform coefficients.
COEFS = cwt(S,SCALES,'wname',PLOTMODE) computes and plots the continuous wavelet transform coefficients.
Coefficients are colored using PLOTMODE. Valid values for the string PLOTMODE are listed in the table below.
COEFS = cwt(...,'plot') is equivalent to COEFS = cwt(...,'absglb')
Note
You can get 3-D plots (surfaces) using the same keywords listed above
for the PLOTMODE parameter, preceded by '3D'. For example:
COEFS = cwt(...,'3Dplot')or COEFS = cwt(...,'3Dlvl') ...
|
COEFS = cwt(S,SCALES,'wname',PLOTMODE,XLIM) computes and plots the continuous wavelet transform coefficients.
Coefficients are colored using PLOTMODE and XLIM.
XLIM = [x1 x2] with 1  x1 < x2
 length(S)
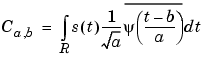
Let s be the signal and  the wavelet. The wavelet coefficient of s at scale a and position b is defined by:
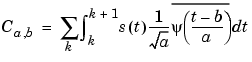
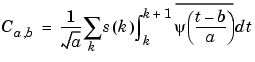
Since s(t) is a discrete signal, we use a piecewise constant interpolation of the s(k) values, k = 1 to length(s).
For each given scale a within the vector SCALES, the wavelet coefficients Ca,b are computed for b = 1 to ls = length(s), and are stored in COEFS(i,:) if a = SCALES(i).
Output argument COEFS is a la-by-ls matrix where la is the length of SCALES. COEFS is a real or complex matrix depending on the wavelet type.
t = linspace(-1,1,512);
s = 1-abs(t);
c = cwt(s,1:32,'cgau4');
c = cwt(s,[64 32 16:-2:2],'morl');
c = cwt(s,[3 18 12.9 7 1.5],'db2');
c = cwt(s,1:64,'sym4','abslvl',[100 400]);
Examples
This example demonstrates the difference between discrete and continuous wavelet transforms.
% Load a fractal signal.
load vonkoch
vonkoch=vonkoch(1:510);
lv = length(vonkoch);

subplot(311), plot(vonkoch);title('Analyzed signal.');
set(gca,'Xlim',[0 510])
% Perform discrete wavelet transform at level 5 by sym2.
% Levels 1 to 5 correspond to scales 2, 4, 8, 16 and 32.
[c,l] = wavedec(vonkoch,5,'sym2');

% Expand discrete wavelet coefficients for plot.
% Levels 1 to 5 correspond to scales 2, 4, 8, 16 and 32.
cfd = zeros(5,lv);
for k = 1:5
    d = detcoef(c,l,k);
    d = d(ones(1,2^k),:);
    cfd(k,:) = wkeep(d(:)',lv);
end

cfd = cfd(:);
I = find(abs(cfd)<sqrt(eps));
cfd(I)=zeros(size(I));
cfd = reshape(cfd,5,lv);

% Plot discrete coefficients.
subplot(312), colormap(pink(64));
img = image(flipud(wcodemat(cfd,64,'row')));
set(get(img,'parent'),'YtickLabel',[]);
title('Discrete Transform, absolute coefficients.')
ylabel('level')

% Perform continuous wavelet transform by sym2 at all integer
% scales from 1 to 32.
subplot(313)
ccfs = cwt(vonkoch,1:32,'sym2','plot');
title('Continuous Transform, absolute coefficients.')
colormap(pink(64));
ylabel('Scale')

% Editing some graphical properties,
% the following figure is generated.
Algorithm

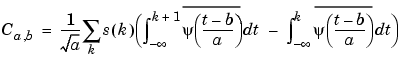
So at any scale a, the wavelet coefficients Ca,b for b = 1 to length(s) can be obtained by convolving the signal s and a dilated and translated version of the
integrals of the form
 (given by
 intwave), and taking the finite difference using diff.
See Also
wavedec, wavefun, waveinfo, wcodemat
| | coifwavf | dbaux | |

 then
then