Today S-PolKa sampled convection
on the southern edge of a major outbreak over the northern
Indian Ocean. This event occurred in the context of phase
1-2 of an MJO, which has begun to weaken (Figure
1). Global model forecasts suggest that it will not
survive beyond phase 2. The general context of the
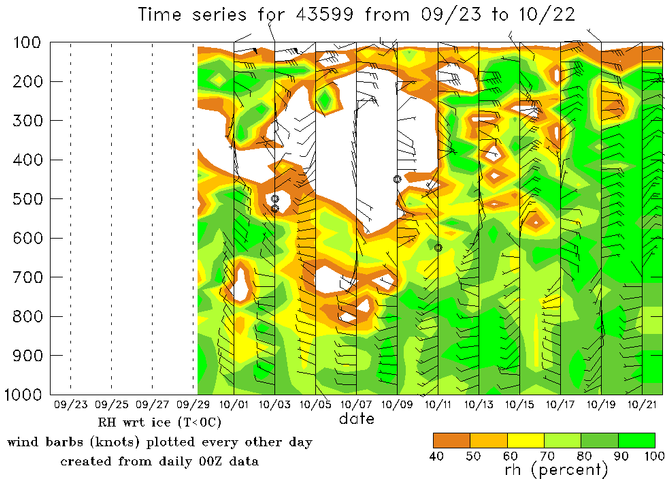
convective events on this day are in a deep moist layer
that contrasts with the dry midlevel conditions of two
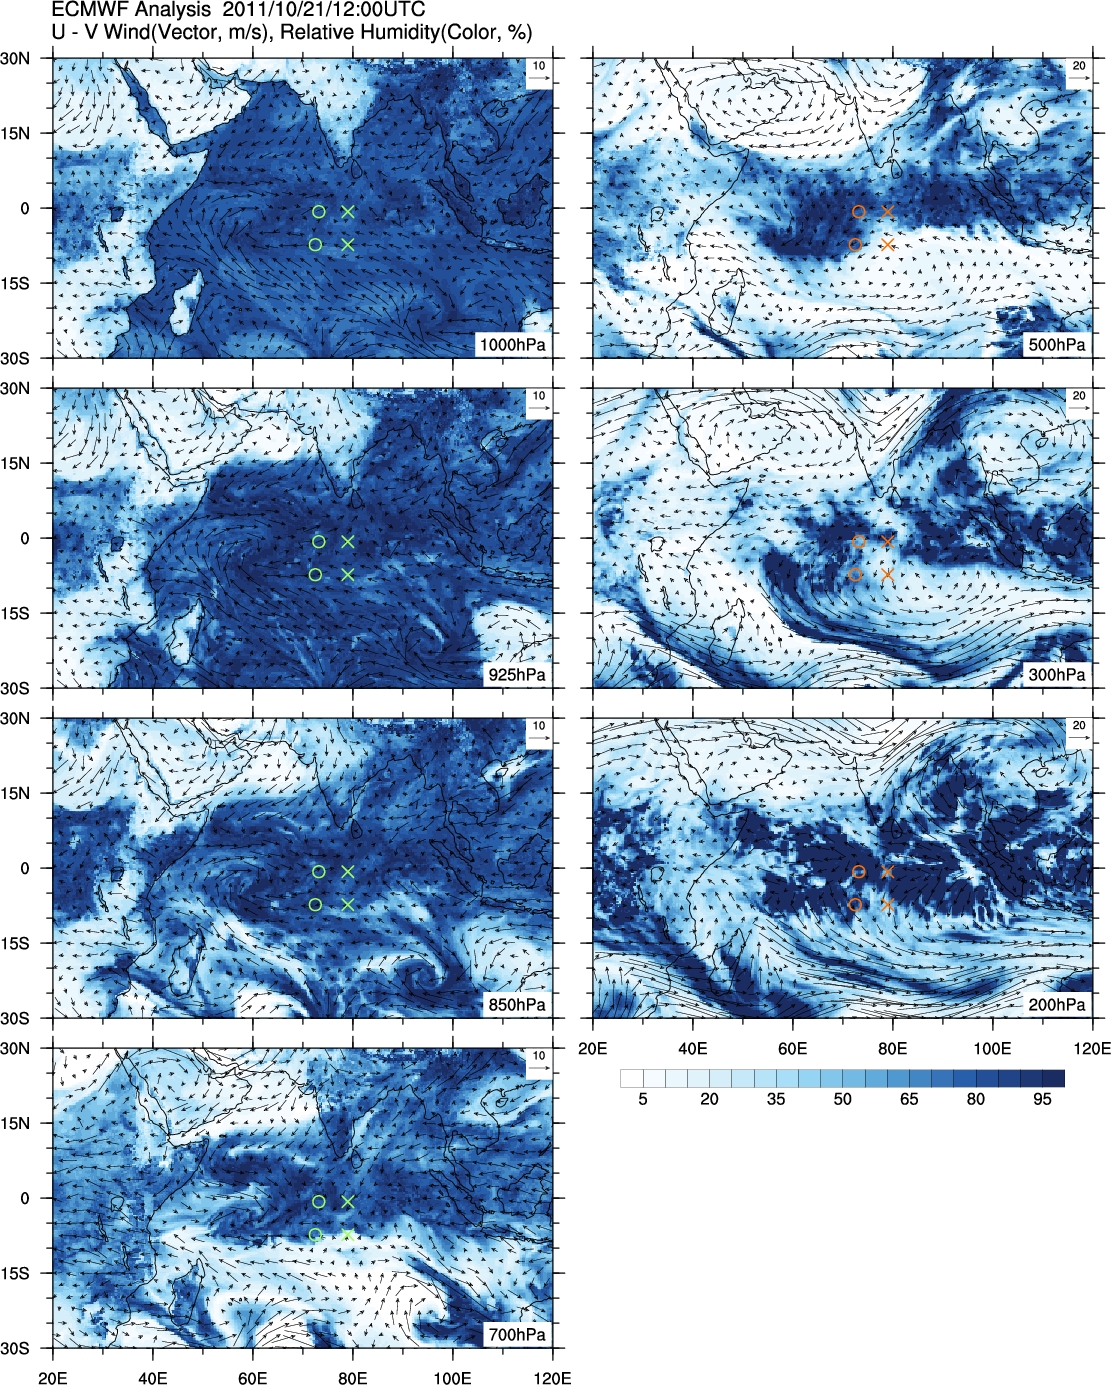
weeks ago (Figure 2). The ECMWF
analyses show weak cyclonic gyres at low levels over the
western Indian Ocean (e.g. 925 hPa in Figure
3) and upper-level anticyclonic gyres over the
eastern Indian Ocean (e.g. 200 hPa in Figure 3)--displaced
from the cyclonic gyres. The convection over the Indian
Ocean has shifted well north of the equator, and north of
Addu Atoll. Figure 4 shows the
locations of lightning at four times over a two-day
period. A marked increase in electrification of the clouds
over the northern Indian Ocean has occured over the last
day. Figure 5 shows the development of
the high cloudiness over the Indian Ocean over a 34 hour
period. At 1900 UTC 20 October, fairly intense cold cloud
topped convection was occurring in a region centered just
west of Gan (upper left panel). This convection expanded
as newer deep convection formed in a giant ring around
this region, and this ring of convection expanded leaving
its center relatively undisturbed. The ring is seen at
0430 UTC 21 October in the upper-right panel of Figure 5. Another ring emanated from a
region of convection centered at about 2 N and 76 E at
0800 UTC 21 October 2011 (lower left panel). In the lower
right panel, it can be seen that this giant ring had it
southmost portion over Gan at 0500 UTC 22
October. This summary describes what was seen by the
S-PolKa radar of this portion of the giant ring.
(Anecdotally, RAH remembers similar giant ring formation
by convection over the West Pacific during TOGA COARE.)
Figure 6 shows SW-NE lines of
convection over the S-PolKa area at 2000 UTC 21 October.
Note the cold cloud tops reaching brightness temperatues
as low as ~200 K in the southern portion of the giant
convective ring, located just outside the S-PolKa 150 km
range circle. A cross section of reflectivity near this
feature showed echo top heights reaching 20 km. A cross
section along one of the intense convective lines showed
cells lofting larger non-melting ice particles to great
heights (narrow light blue shafts at 50, 70, and 100 km
range in the lower-right panel of Figure
7. The ability of these cells to loft ice to such
great heights is consistent with the formation of
lightning seen in Figure 4.
However, these cells were not producing lightning, which
leads to the inference that the convection far to the
north was even more intense than that seen on the S-PolKa
radar! The precipitation seen by the S-PolKa S-band at
2130 UTC showed that the precipitation in the SW-NE bands
was predominantly convective, but some of the northernmost
precipitation seen by the radar was turning stratiform
(rightmost panel of Figure 8).
Although the precipitation in the northern region of radar
coverage was gradually turning more stratiform, it still
contained embedded intense cells. Some of these were
lofting larger ice particles to over 14 km at 2130 21
October (light blue column at 100 km in Figure 9). This stratiform
precipitation was likely from collapsing previously
intense convective cells. An hour later, portions of the
strong bright band (e.g. 30-40 km range in Figure
9) showed evidence of graupel particles (green in
the particle idenfication panel, lower right of Figure
9) both above and below the layer of melting
aggregates (grey/blue layer in the lower right panel).
This signature is highly suggestive that this stratiform
precipitation was the collapsed phase of a previously
intense convective cell. An hour and a half later, the
stratiform precipitation was still more widespread. The
particle identification panel in Figure
10 shows a cross section through the now huge region
of stratiform precipitation at 0001 UTC 22 October. The
polarimetric particle identification algorithm shows
likely collapsing convection at 90-110 km range. Another
feature that we are seeing regularly in the deep
convection in this region is the fringe of purple around
the upper edges of the ice echo. These are weakly
reflective particles showing horizontal orientation. We
think they are proably pristine columns at low
temperatures. At 0115 UTC 22 October, the S-PolKa echo in
the northern zone contained a large portion of embedded
convective cells (yellow in the rightmost panel of Figure 11). The satellite infrared
brightness temperatures were extremely cold (190-196 K) in
the pink region of cloud tops NNE of S-PolKa, near where
the embedded convective cells were located. Closer to the
S-PolKa radar, the embedded convection was also still
intense. Figure 12 shows
three lines of convection near the southern edge of the
broader echo region to the north at about the same time as
Figure
11. At this location the three lines were separated
by regions of weak or no echo. From the satellite image
underlay in the upper panel of Figure
12, they appear to have been extensions of the lines
of SW-NE oriented cloud lines to the southwest of S-PolKa.
These cloud lines appeared to be "feeding" the larger
cold-cloud-topped feature to the north. Two hours later,
at 0300 UTC, the broad echo feature to the north was still
very active convectively. Three regions of intense echo at
low levels were embedded north of the radar (upper panel,
Figure 13). A cross section
through these convective regions shows that they were
still convectively active (lower panels of Figure
13). These convective cells were not reaching quite
as high as those seen earlier far to the north, but the
more active cells were still lofting large amounts of
larger ice particles (light blue, dry snow) up to 10-12
km. The active cells at 35 and 50 km range were also
pushing wet snow and graupel (grey-blue and green)
upwards, above the environmental 0 deg C level. At 100-110
km range, a cell was collapsing and becoming stratiform,
and it shows melting graupel below the bright band.
After sunrise, the area to the north of the S-PolKa radar
appeared dark on the horizon with rain, and the sky was
over cast with multiple cloud layers from the massive
cloud system to the north (Figure
14). At 0300 UTC 22 October, the METEOSAT visible
image (Figure 15) showed the massive
cloud system north of Gan and the feeder lines to the
south. At this time, the lines were oriented SSW-NNE. By
0515 UTC, the precipitation north of S-PolKa was
indicating that the massive cloud system on the south side
of the giant ring of convection was becoming mostly
stratiform (rightmost panel of Figure
16). This region of echo continued to be stratiform
and weakening for several more hours (e.g., see the
pattern at 0700 in Figure 17).
The visible image in Figure 18 shows
that the feeder lines south of the giant ring of
convection were becoming S-N oriented as the system moved
generally westward. Radar data from the Revelle show echoes
from these lines in Figure 19;
however, the line orientations are only faintly visible
since the radar-echo cell locations are primarily
determined by cold pool boundaries and intersections as
our previous summaries have pointed out.
|