Yesterday was a major rain event
at Gan and over the whole area scanned by the S-PolKa
radar. The total rain area and rain amount over the radar
area are shown in Figure 1 along
with curves showing the breakdown into convective and
stratiform components. Before 0400 UTC, the convective
rain amount (upper panel) was greater than the stratiform.
After that the rain was predominantly stratiform over the
radar area. The rain area (lower panel) was mostly
stratiform for the entire period. This rain event was
associated with a giant ring of convection of the type we
discussed in our 22 October summary. However, in that
event S-PolKa observed convection on the edge of the ring
at a late stage. In this event, S-PolKa observed
convection in the outbreak that was the source of the ring
that propagated outward. The METEOSAT imagery in Figure 2 provides an overview of the
sequence. The first image (1400 UTC) was before the event
started. At this time, significant convection was well
east of Gan and over the Revelle (location NE). The Revelle radar was
observing a mesoscale echo system with SW-NE and WSW-ENE
oriented lines of convection and associated stratiform
precipitation areas (left hand panel of Figure 3). The line west of the Revelle at this time
was propagating toward the ship. However, this mesoscale
convection was not ultimately associated with what
occurred subsequently over the S-PolKa area. The 1830 UTC
image in Figure
2 shows several small cells of high cloud tops
appearing between the Revelle
and Gan. These cells are the beginning of the outbreak
observed by S-PolKa. In the next two panels, these cells
were growing larger and moving into the S-PolKa area. By
0440 UTC (fifth panel of Figure
2 ) it was raining steadily at Gan. The radar
sequence during this time will be discussed in some detail
below. By about 0840 UTC, the ring of convection could be
identified from the satellite infrared image. The cold
cloud tops had moved SW of Gan, there was some clearing
between Gan and the Revelle,
and the Revelle
radar was seeing mesoscale rain areas with embedded
convective cells (right panel of Figure
3). The giant ring of convection continued to expand
through 0030 UTC 25 October 2011 (last four panels of Figure 2
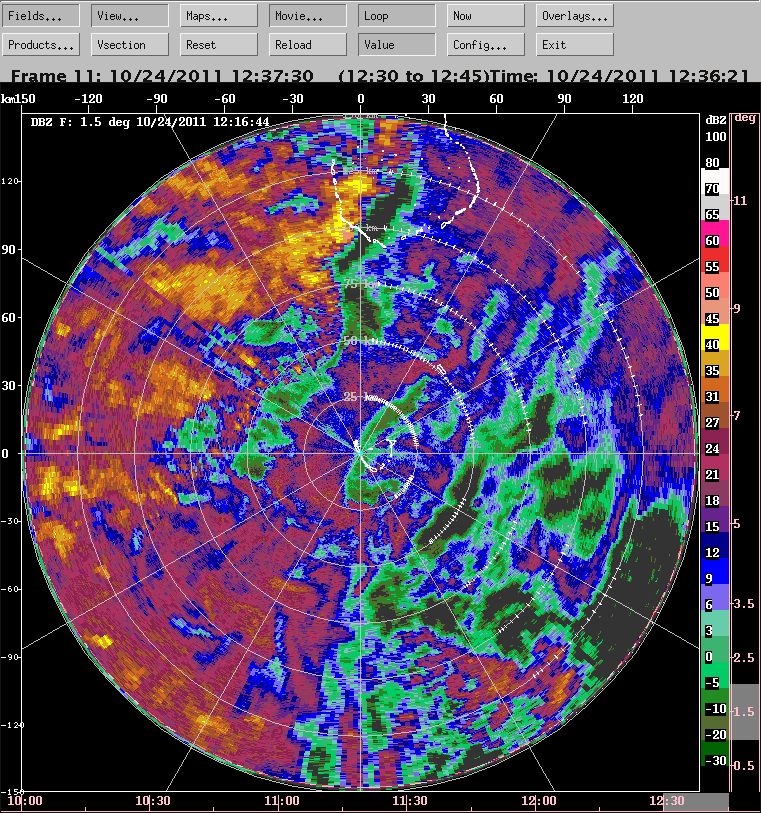
). Figure 4 shows the echo
pattern seen on the S-PolKa S-band radar at 0100 UTC. The
area to the east of S-PolKa was convered by radar echo and
WSW-ENE oriented lines of convection were located to the
west. One line was extending nearly directly over Gan at
this time and intersecting the stratiform region. Although
a great deal of stratiform rain was to the east of the
radar, the rightmost panel of Figure
4 shows that convective cells were embedded in the
stratiform region. As will be shown by cross sections
below, these cells were very deep and intense. Time-lapse
viewing of the images shows that the cells in the lines to
the west were moving eastward into the stratiform region,
while the stratiform region was moving westward. Figure
5 shows the time sequence of the radar echo
pattern on the S-PolKa S-band radar for a little over five
hours. Where the lines of convection to the west were
intersecting the stratiform zone, very intense convective
cells were seen, for example ENE of the radar at 0146 UTC
and in the SE quadrant at 0246 and 0316 UTC. After that
time (0446 and 0701 UTC in Figure
5), intense convection was still present but just
out of radar range, as seen in the satellite image in the
last panel of Figure
5.
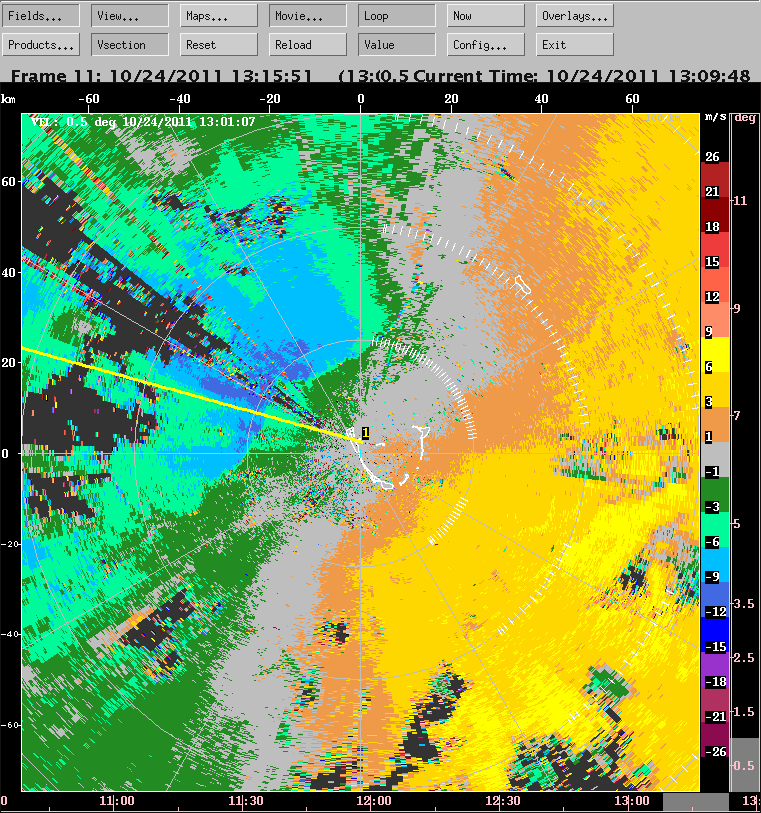
At 0146 UTC, the S-PolKa S-band PPI shows one of the
WSW-ENE bands west of Gan intersecting the radar site and
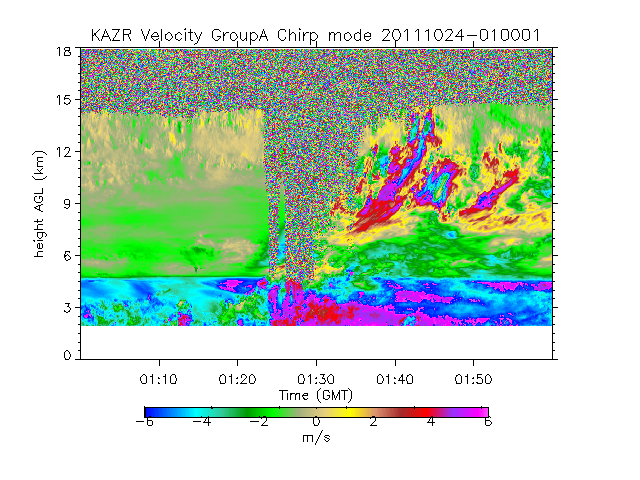
Gan Island. The DOE Gan KAZR vertically pointing Ka-band
radar obtained an interesting time section of this event (Figure 6). It shows downdraft at about
0117 UTc over ridden by updraft. The upper extension of
the updraft slopes upward from ~0130-0145 UTC. The updraft
speeds exceed 5 m/s.
The S-PolKa rain maps at 0200 (Figure
7) illustrate the intersection of the intense
convective cells in the lines to the west with the large
stratiform region to the east. The embedded cells in the
stratiform zone appear to be extensions of the lines into
the stratiform region, and much of the stratiform region
contains embedded cells, some of which were very intense.
Figure 8 shows the structure of
an intense cell to the east. This cell was reaching over
17 km in height (lower left panel). The radial velocity
data showed a gust front at about 105 km and a divergent
signature near echo top. A convective-scale patch of
enhanced outbound radial velocity is seen at the cell
location in the PPI (upper left panel), indicative of
downward transport of westerly momentum. The polarimetric
particle identification pattern (upper and lower left
panels) shows heavy rain at low levels with the cell
lofting larger ice particles (light blue) to about 15 km
height. Graupel signatures are seen both above and below
the melting layer, both in the active cell and in the
heavier stratiform zones surrounding the cells. The latter
signatures are consistent with the stratiform
precipitation being formed as convective cells collapse.
The rain pattern over the S-PolKa region at 0300 UTC (Figure 9) look much the same as at
0200 UTC. Figure 10 shows
another example of an intense cell embedded in the
stratiform echo reaching about 17 km. This cell is so
intense that it seems to have produced some upper-level
clearing on either side of the cell, as if by upper level
downdrafts responding to the buoyancy in the cell. The
particle identification signatures (lower right) show a
strong graupel signature right above the 0 deg C level and
also some possible graupel mixed with the rain below. As
in the other example, larger (more reflective) ice
particles were being carried up to about 15 km. Figure 11 shows an example
similar to the previous two examples in all respects. The
radial velocity footprint of momentum transport is
particularly strong in this case (upper right panel). Figure 12 shows an example of one
of the embedded cells in the process of collapsing and
turning into stratiform echo. Apparently, cells fed into
the zone of widerspread echo from the west, grew into very
intense cells, and collapsed into dense stratiform echo,
which in turn was advected back westward.
Figure 13 shows that the S-PolKa
rain pattern at 0400 UTC still contained substantial
convection embedded in the broader stratiform echo
pattern. At this time the S-PolKa site was under this echo
region. Figure 14 shows the overcast
and rain at 0419 UTC. It is interesting that the
cloud base was low. The stratiform cloud was not
midlevel-based as might have been expected. At 0600, the
precipitation on radar was nearly all stratiform (Figure 15). The Gan 0600 UTC
sounding had a Zipser "onion" profile, of the type
associated with stratiform anvil clouds (Figure
16); the warming and drying below 600 hPa gives the
sounding an onion-like shape on the Skew-T diagram. The
0800 UTC rain pattern on S-PolKa was nearly all stratiform
(Figure 17). However, the METEOSAT
infrared satellite underlay in Figure
17, shows extremely cold cloud tops (~200 K) to the
southwest, just beyond the maximum range of S-PolKa. The
deep convection was evidently still active in this region,
just out of radar range. The World Wide Lightning Location
Network data show a lightning strike in the region (Figure 18), which is consistent
with the large ice particles that we have seen being
lifted to high levels (Figures 8,
10, and 11).
After the major event just described, a line of covection
orinted SW-NE moved across the northwest quadrant (Figure19). It had a well defined
gust front with (lower panel). The relationship of this
line of convection to the other events of the day remains
unclear.
|