Today
featured significantly less convective activity in the
S-PolKa domain than the previous two days.While the
200 hPa synoptic map (left panel of Figure 1) shows that
the near equatorial region near Gan and the Revelle have
southeasterlies, most of the southern DYNAMO array has
easterlies. Conditions at 700 hPa (center panel of Figure 1) are
characterized by light and variable winds near Gan and
the Revelle
and easterlies near Diego Garcia and the Mirai. At 925
hPa (right panel of Figure 1) the entire
southern DYNAMO array is characterized by easterlies.Figure 2 shows that
soundings taken in Male, Gan, Diego Garcia, and at the
Revelle at
0601 UTC have light winds through 200 hPa. While Diego
Garcia and the Revelle have an easterly component
through the depth of the troposphere, Male and Gan
have a small region of westerlies at approximately 750
hPa (2 - 3 km altitude). This wind profile is
consistent with the maps discussed in Figure 1.
Additionally, each of the soundings have dry
conditions above 600 hPa. The upper levels have
exhibited a drying trend for the last few days in
association with large-scale subsidence. Figure 3 shows a
large maximum of positive 200 hPa velocity potential
over the central Indian Ocean. Positive upper level
velocity potential is indicative of convergence and
sinking motion through the column. Evidence of
large-scale subsidence is also seen in the soundings.
Each of the soundings in Figure 2 have a
slight subsidence inversion at approximately 550 – 500
hPa. Brandon Kerns also notes this large-scale
subsidence in the 14 November 1800 UTC Daily Weather Briefing.
The most significant convection today was west of
the DYNAMO array. Figure 4 (top)
indicates that a large amount of lightning occurred
in the half hour preceding 0531 UTC. This high flash
frequency was observed throughout the day in these
two regions. The bottom panel of Figure 4 indicates
that the infrared temperatures at 0531 UTC in the
three electrically active convective centers were
near 200 K.
Within the S-PolKa domain, the day started with a
number of large cold pools. Not only were these cold
pools evident in the reflectivity, but they were
also associated with large differential reflectivity
values, which has been a common occurrence
throughout DYNAMO (top panels of Figure 5).
Vertical cross sections through these cold pools
indicate that these features extended to
approximately 800 m in altitude. The differential
reflectivity (upper right panel of Figure 5) had
exceptional high values near islands, especially on
the western side of Addu Atoll. These are some of
the highest differential reflectivities we have
observed and it is unclear why this enhancement is
occurring.
The top panel of Figure 4 shows
that the belt of convection that has been affecting
the S-PolKa domain for the last few days has moved
to the south. Thus, S-PolKa was located between the
strong convection to the northwest and the belt of
larger cumulus to the south. During the late
afternoon shallow cumulus and cumulonimbus began to
form in northwest - southeast oriented lines as
illustrated in the top panel of Figure 6. Infrared
temperatures at 1101 UTC (bottom panel of Figure 6) indicate
that the temperatures were only about 260 K. At
later times, cloud top temperatures reached a
minimum of 250 K. These shallow lines of cumulus,
when viewed in time lapse, were oriented and moved
from northeast to southwest. This motion is
consistent with northeasterly flow observed at low
levels throughout the day in the Gan soundings
(upper right panel of Figure 2).
A representative example of
afternoon convection observed in the S-PolKa domain
today is shown in Figure 7. Even the
strongest cells barely reached 8 km and quickly
dissipated. The shallow band of westerlies noted in
the Gan sounding above (upper right panel of Figure 2) is
evident in Figure 7 as a band
of outbound velocities at approximately 3 km.
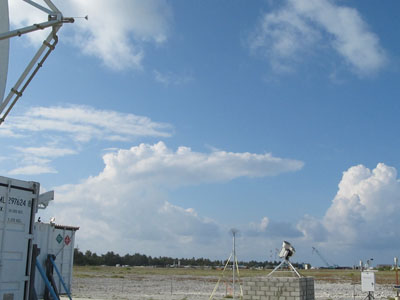
Figure 8 visually
shows the variation of the cloud population
throughout the day. Morning convection was limited
to shallow cumulus (left panel). However, by early
afternoon deeper cumulus began to form in lines
(center panel) and isolated cumulonimbus developed
in the late afternoon (right panel). Additionally,
the left panel of Figure 8 shows
that the anvils were shearing towards the east,
which is uncommon.
Figure 1.
Indian Meteorological Department 0-hour analyses for
0000 UTC 15 November 2011.
Figure 2.
Soundings at Male (upper left), Gan, (upper right), the
Revelle (lower
left), and Diego Garcia (lower left) at 0601 UTC 15
November 2011.
Figure 3. 200
hPa Velocity Potential anomolies (positive brown
contours, negative green contours) and daily IR
temperature(fill) for 14 November 2011 from the CPC MJO
working group.
Figure 4. Top
Panel: Lightning flashes from the World Wide Lightning
Location Network superimposed on METEOSAT infrared
imagery at 0531 UTC 15 November. All flashes over the 30
minutes prior to 0531 UTC are shown. Bottom Panel:
METEOSAT infrared images at 0531 UTC 15 November 2011 on
a different color scale.
Figure 5. Top
Row: SPolKa S-band 0.5 degree elevation PPIs for 0046 -
0501 UTC 15 November 2011 reflectivity (left panel) and
differential reflectivity (right panel). Bottom row:
RHIs along the yellow line shown in the PPIs above of
reflectivity (left panel) and differential reflectivity
(right panel).
Figure 6. Top Panel:
METEOSAT visible imagery. Bottom Panel: METEOSAT infrared
imagery at 1101 UTC 15 November 2011.
Figure 7. SPolKa
S-band radar data valid from 1031 - 1046 UTC 15 November
2011. Top Panel: PPI of reflectivity. Bottom Panel: RHIs
along the yellow line in the PPI of reflectivity (left
panel), hydrometeor type (center panel), and radial
velocity (right panel).
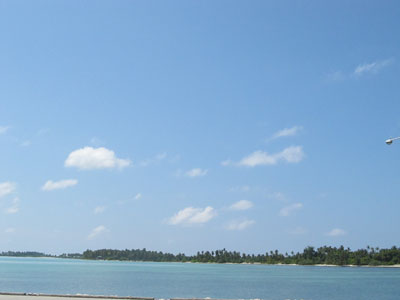
Figure 8. Photos
taken by Kaustav Chakravarty at SPolKa site on 15 November
2011. Right Panel: 0500 UTC facing south. Center Panel:
0941 UTC facing north-northeast. Left Panel: 1038 UTC
facing north-northwest.