This day had two major events in
the vicinity of S-PolKa. Both events were associated with
SW-NE lines of convection. Early in the day, a gust front
associated with one convective line rushed dramatically in
a southeastward direction over S-PolKa, while the upper
stratiform anvil portion was sheared off to the east. The
later system consisted of several lines of convection that
evolved into widespread stratiform precipitation, mostly
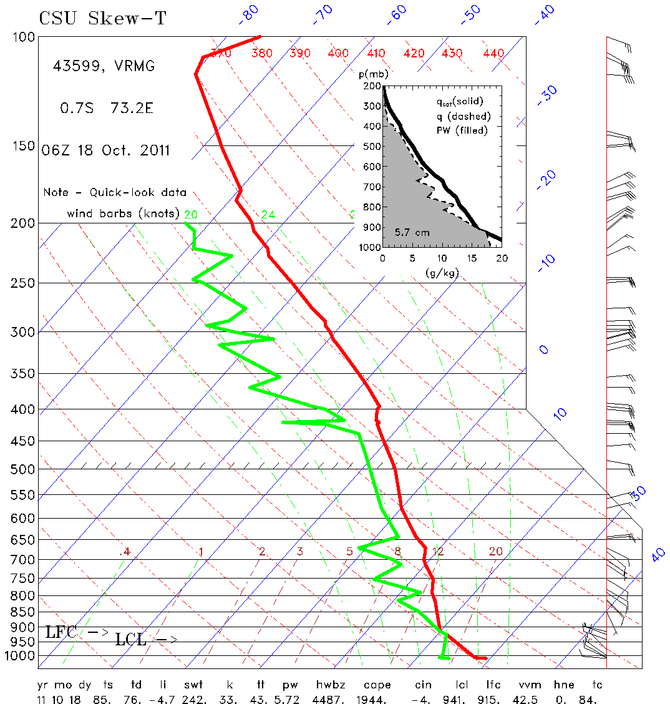
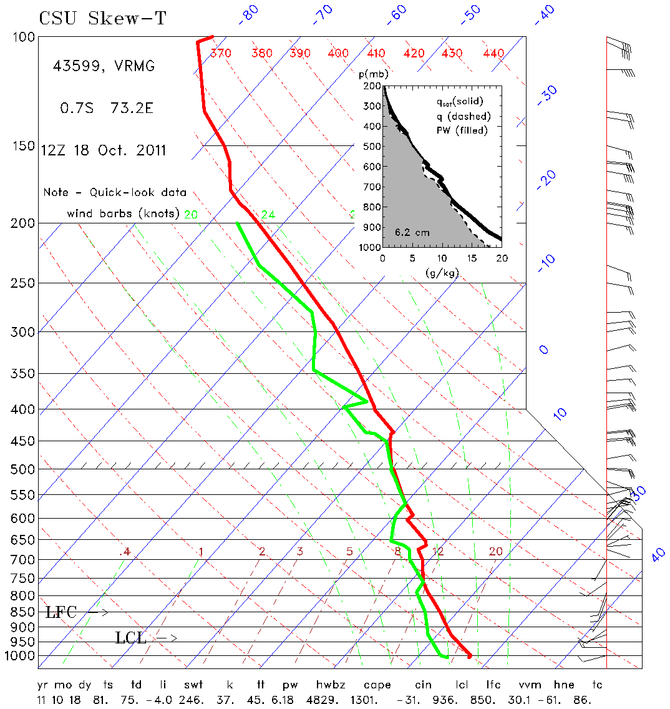
southeast of S-PolKa. The DOE Gan soundings (Figure 1) showed a fairly dry upper
troposphere at 0600 UTC. By 1800 UTC, with the upper
levels dominated by stratiform anvil clouds, the upper
troposphere had become nearly saturated. The METEOSAT
infrared image in Figure 2 shows
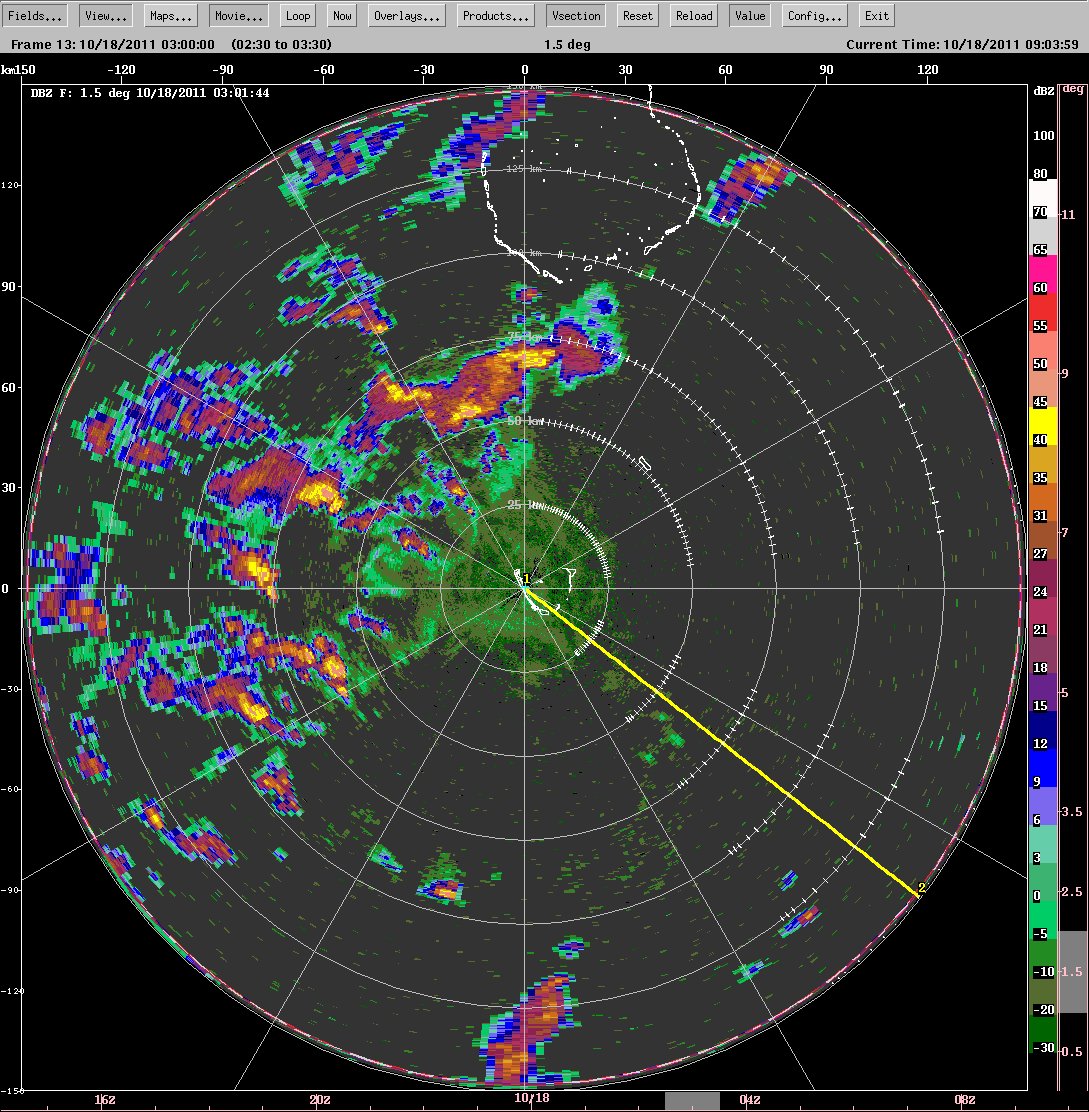
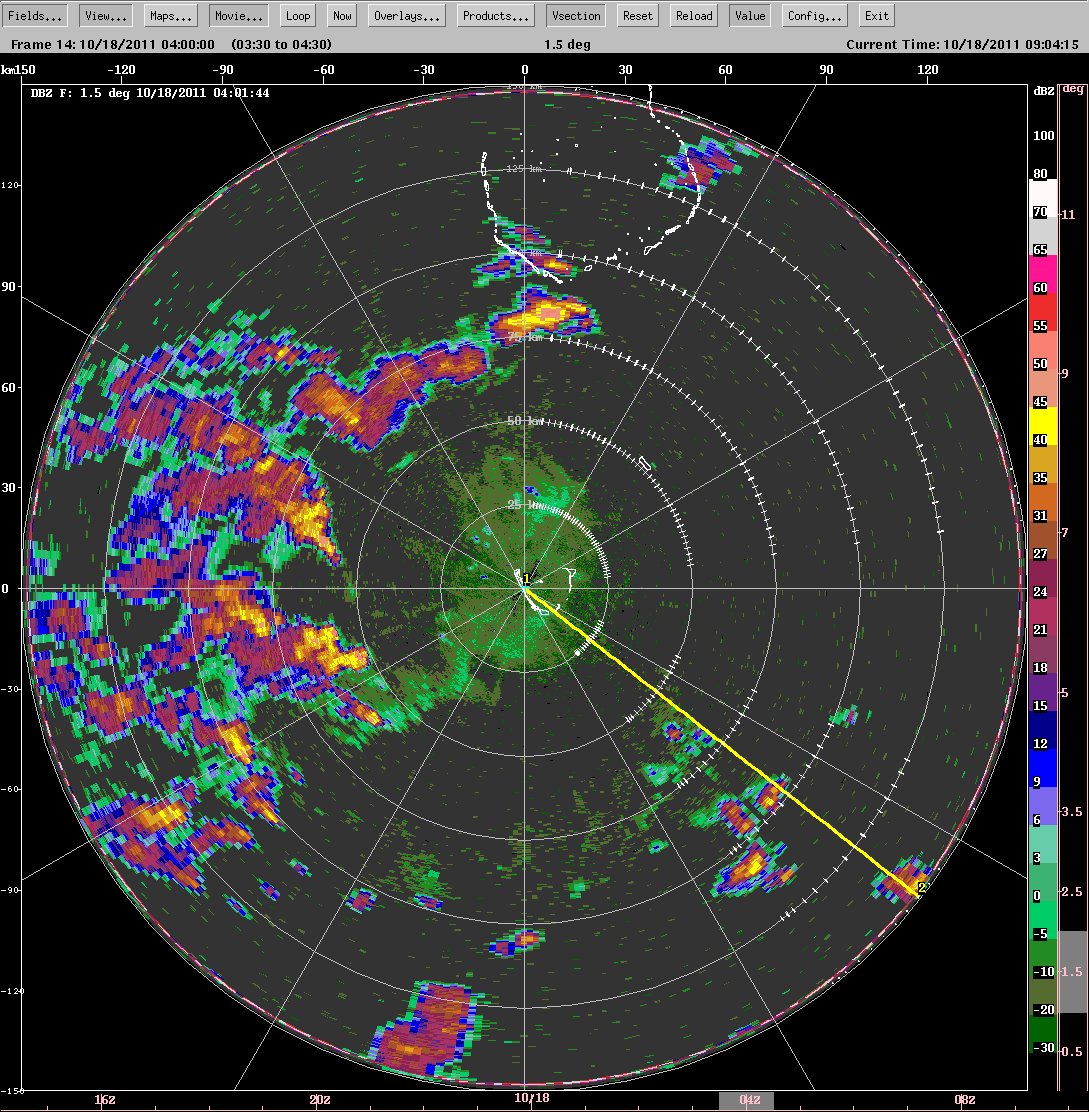
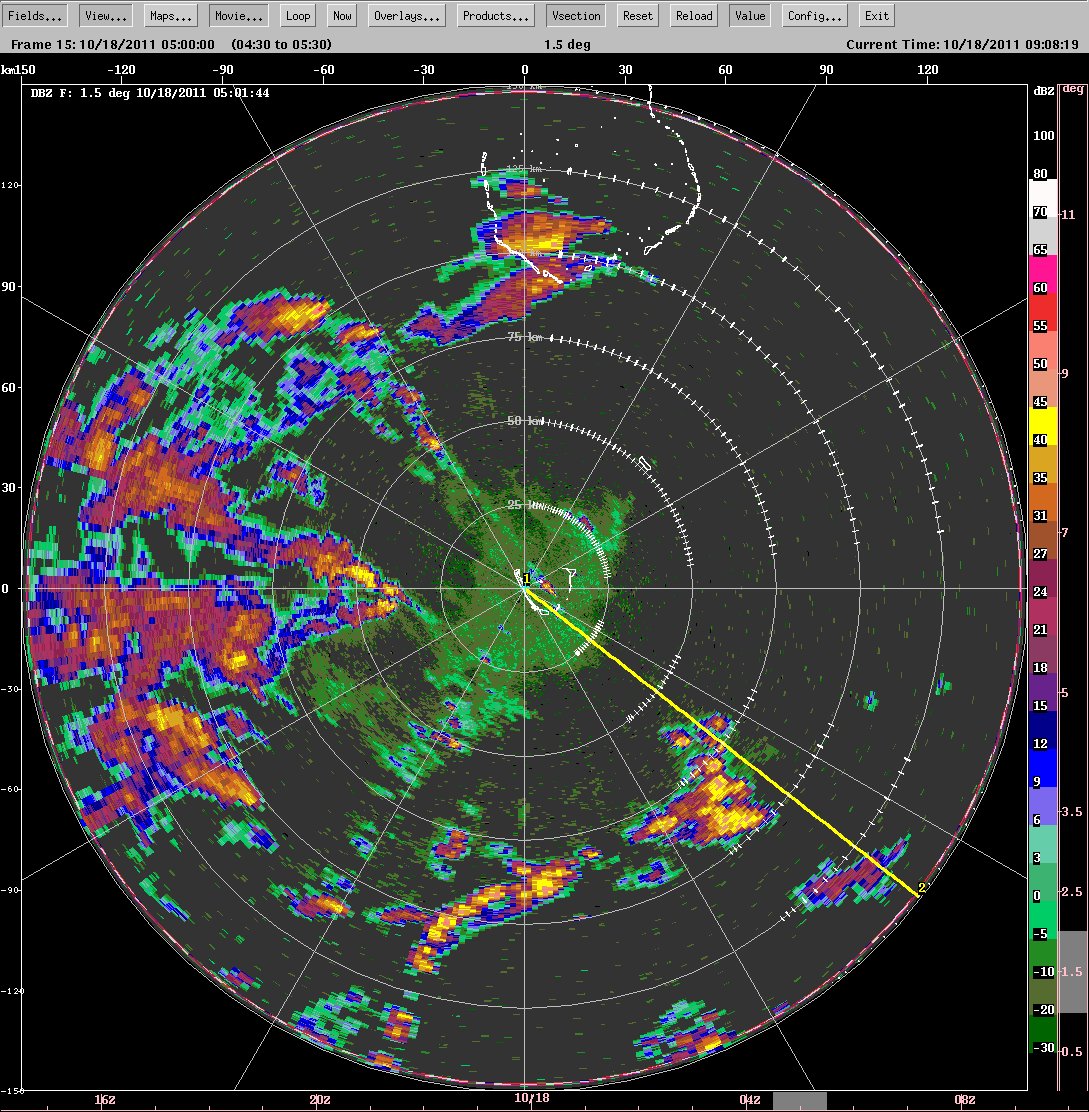
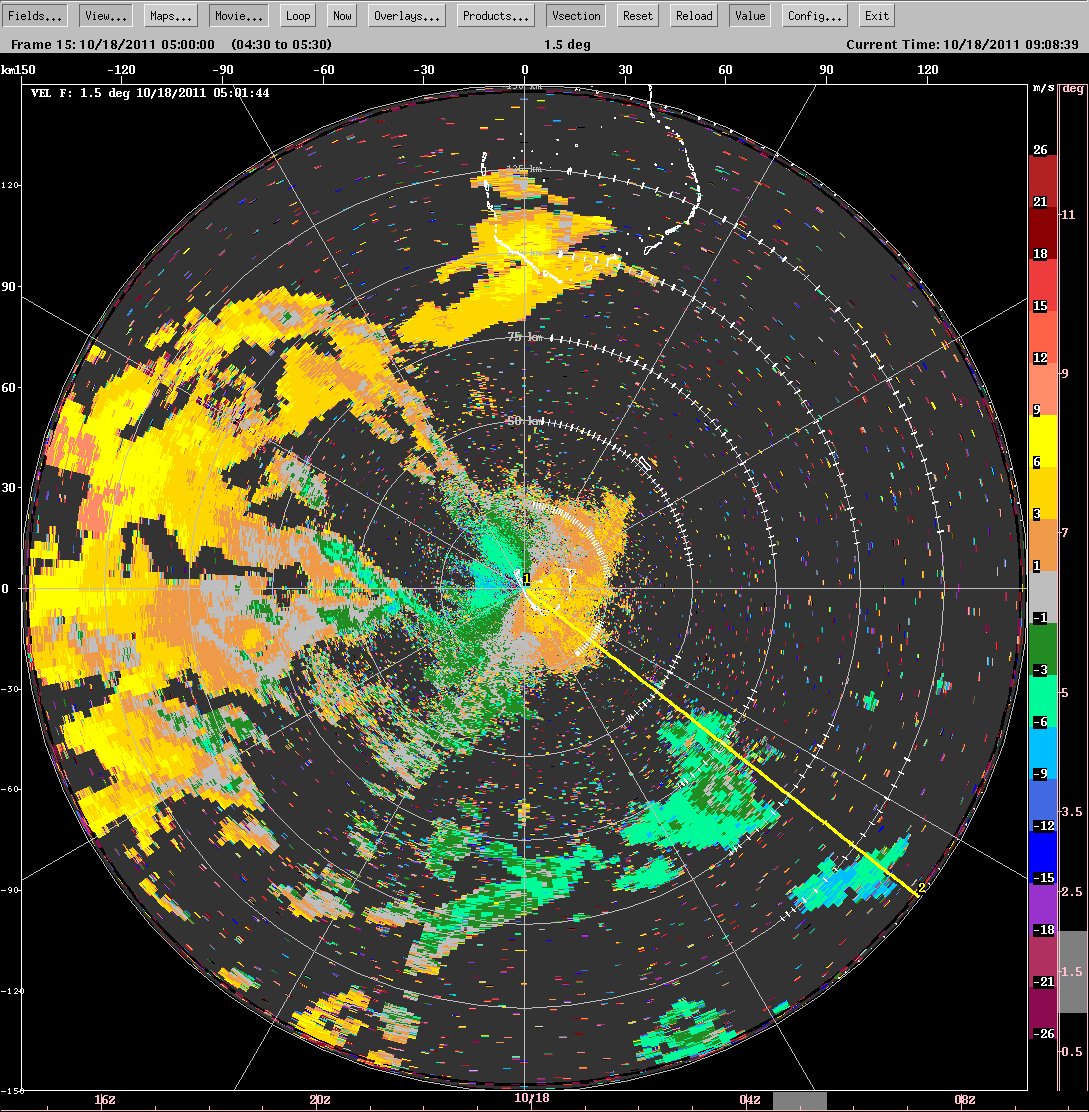
the early morning convective line just northwest of Gan. Figure 3 shows the progression of
the radar echo pattern on S-PolKa between 0300 and 0500
UTC 18 October. The upper portion of the convective line
is seen shearing off to the west, while a line of weak
echo along the gust front moves rapidly toward the
southeast, across the S-PolKa site. The radial velocity
pattern in the lower right panel of Figure
3 shows a relatively strong northwesterly flow
behind the gust front line. The echoes along the gust
front seen in the lower left panel have a streaky
appearance, probably because these echoes are produced by
the non-precipitating clouds along the gust front, and
these cumuli were highly sheared (Figure
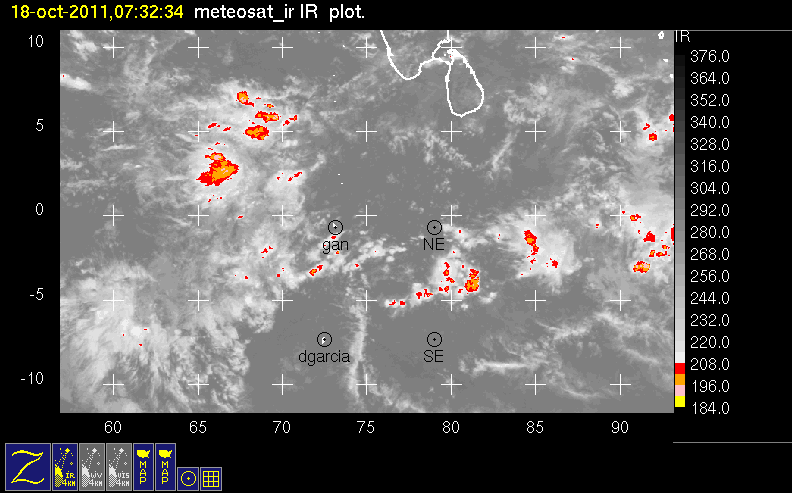
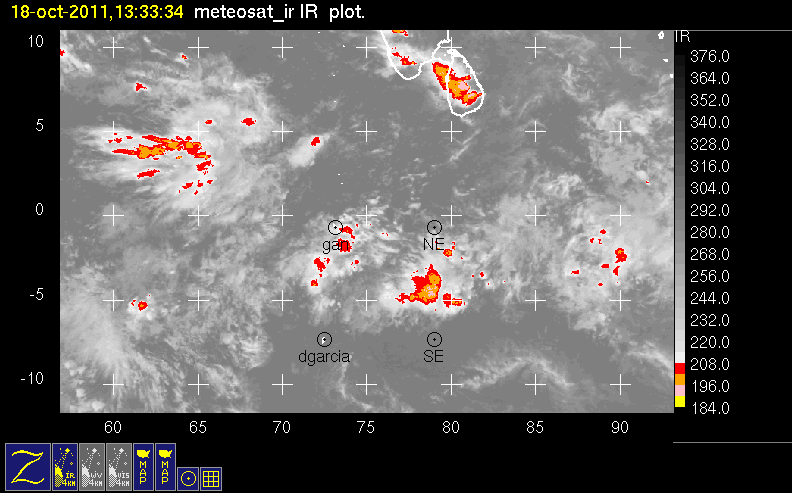
4). At about 0730 UTC (1230 local), a new
southwest-northeast oriented line of convection was
forming to the southeast of S-PolKa. In the METEOSAT
infrared image in Figure 5, it
exhibited a few cloud tops with brightness temperatures
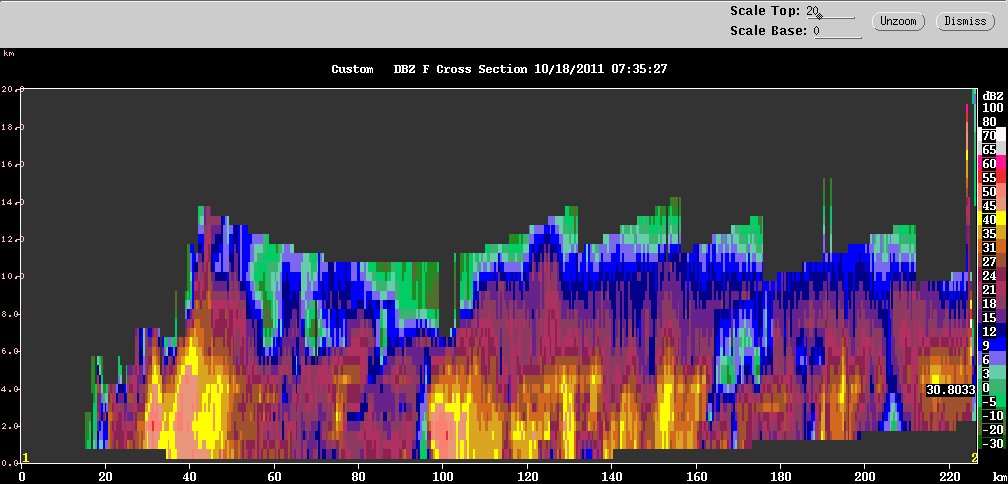
<208 K. The photographic panorama in Figure 6 shows the visual
appearance of the line, with building convection on the
southwest side and a thick expanding anvil on its
northwest end. The radar echo pattern seen by S-PolKa in Figure 7 showed echo tops up to
13-14 km. The infrared images in Figure
8 show how the line continued to grow and new lines
formed parallel to it for the next few hours. This growth
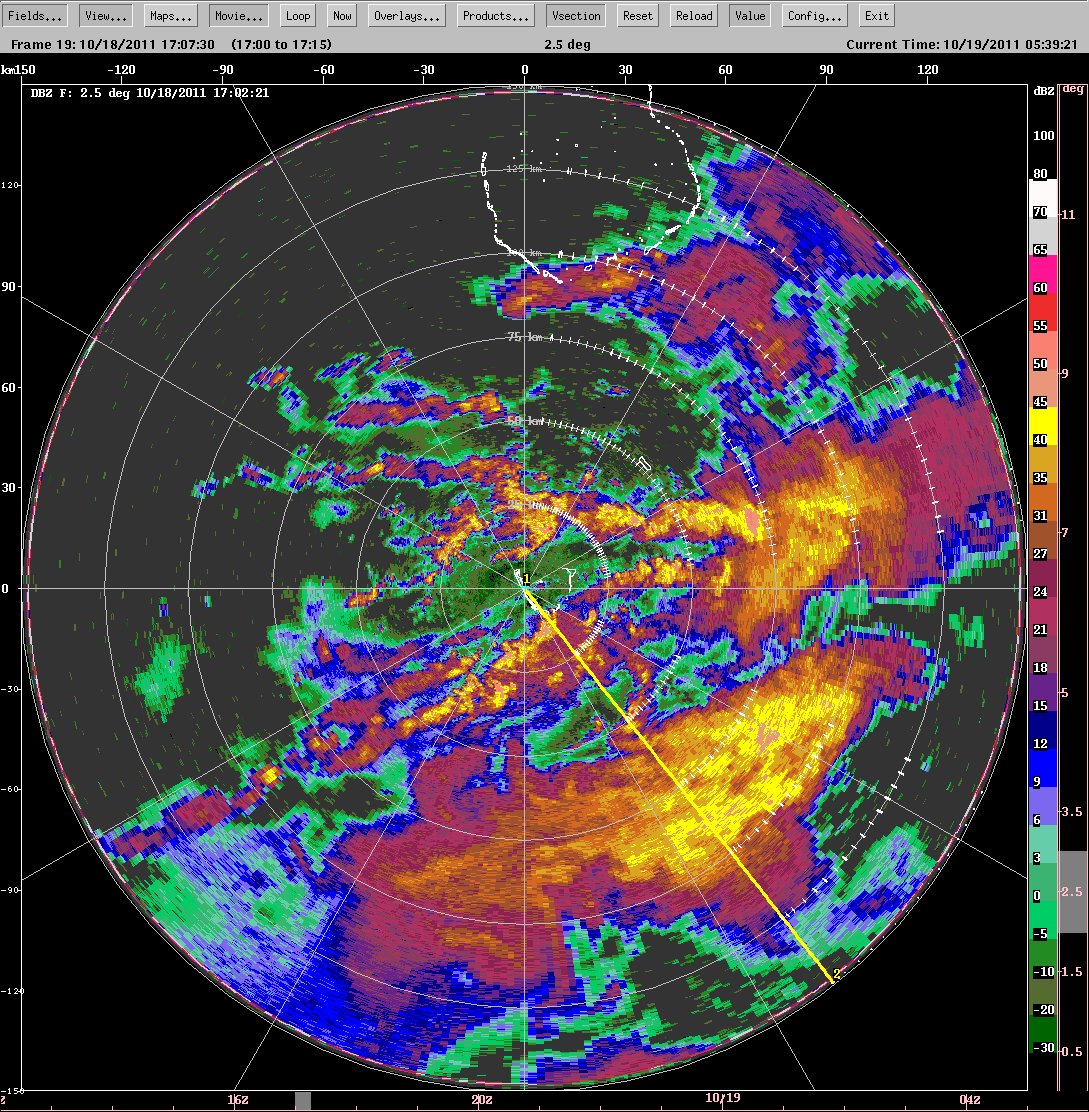
led to the S-PolKa radar echo pattern in Figure 9 around 1700 UTC, which
shows several mesoscale echo features, the most prominent
being the relatively new convective lines northwest and
southeast of the radar site at close range and large
stratiform echo patterns at farther ranges to the east and
south east. The RHIs in Figure
9 show a penetrative cell extending up to over 17 km
and completely surrounded by stratiform precipitation with
a bright band. The polarimetric particle identification
algorithm sees melting aggregates (blue/gray) at the
bright band level and some green spots likely indicating
graupel in the convective cell. The radial velocity
pattern shows a channel of outbound flow (yellows and
oranges) extending all the way to echo top, a likely
signature of the updraft. The top of this updraft exhibits
a divergence signature.
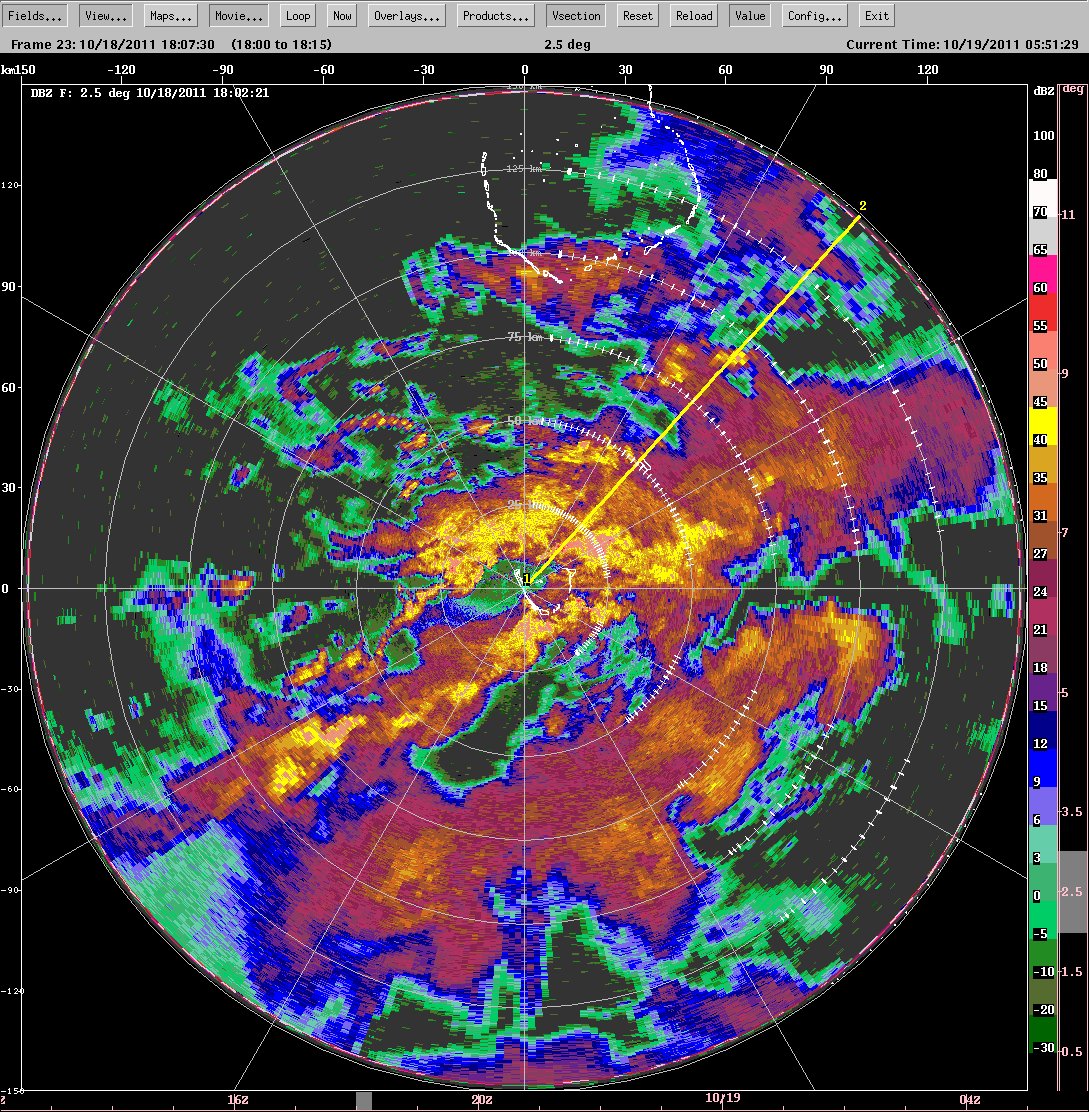
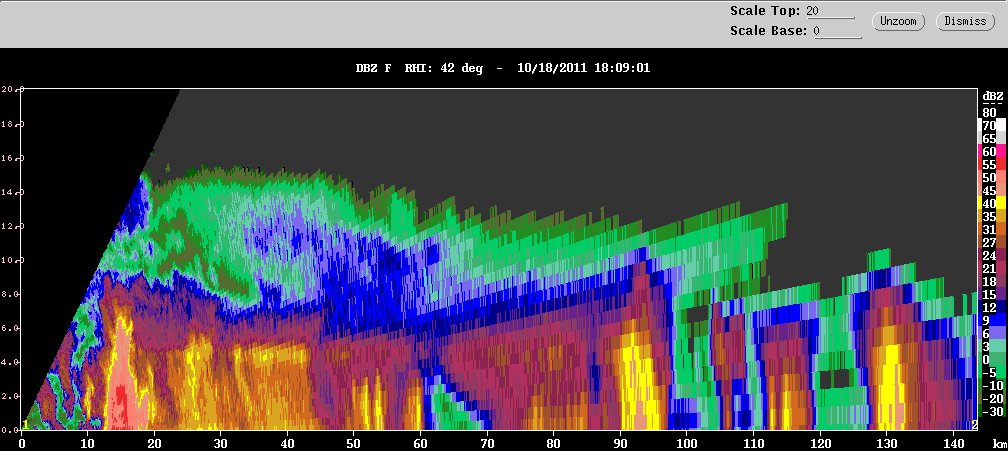
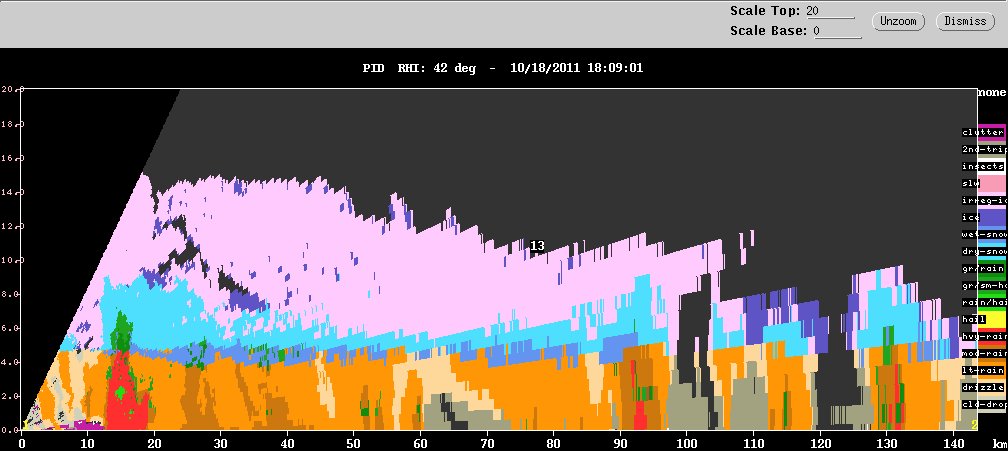
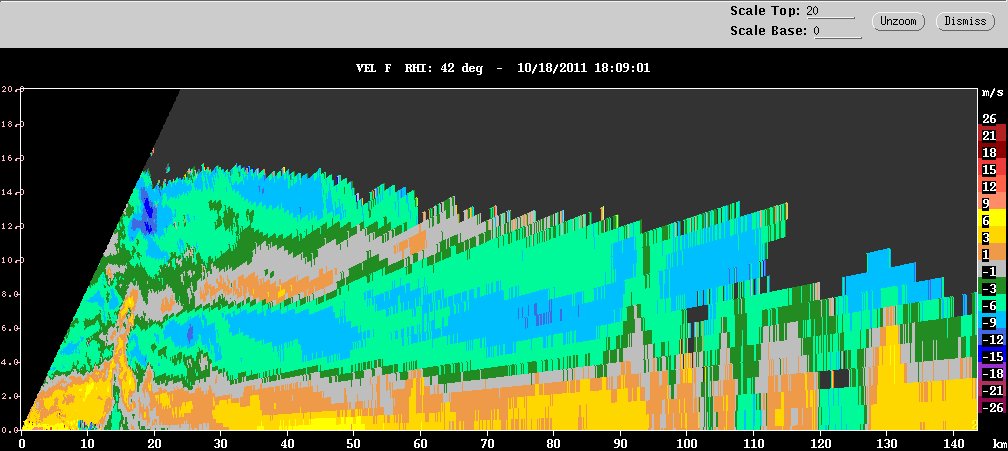
The
convection close to S-PolKa continued to intensify over
the next hour (Figure 10). A
cross-section through the most intense core (top RHI
panel) shows very high reflectivities (>55 dBZ) along
the leading edge with a stratiform region marked by a
bright band with fallstreaks on its northeast side.The particle
identification algorithm at this time triggers the light green category, which
is nominally "rain mixed with hail" below the 0 deg C
level (middle RHI panel). However, this (and other categories of
the particle identification algorithm) are tuned for
midlatitude continental storms, and we think that in
this case it is more likely that the algorithm is
triggered by some larger graupel particles mixed with
heavy rain. There is
a small amount of darker green (graupel) at the top of
the core. The radial velocity signature (bottom panel)
shows a convective-scale downdraft signature in the
form of inbound velocities (green colors) near the
surface at about 12-15 km range. These inbound
velocities collide with the strong outbound velocity (yellow/orange) near the surface. The
outbound velocities are carried upward, at first
steeply and then along a highly sloped path.
Underneath this sloping outbound updraft flow was an
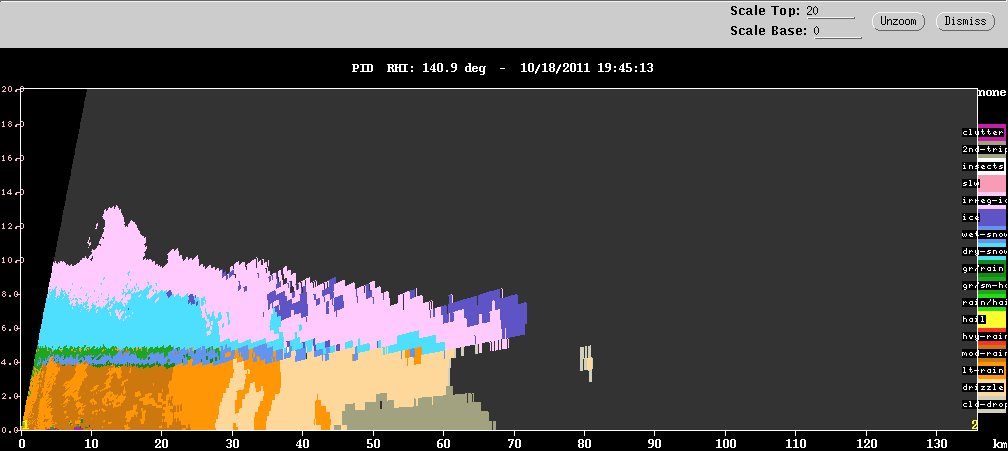
inbound subsiding midlevel inflow. As the
evening progressed, the system became dominated by
stratiform. An example of the
robust stratiform precipitation is shown in Figure 11, where the RHI of
reflectivity shows values of 50 dBZ in the bright band.
The polarimetric hydrometeor algorithm shows al lot of
nonmelting aggregates in the melting layer (grey/blue),
with some indication of graupel or some other larger ice
particle (medium green) above the dry aggregates, and
large raindrops (darker green) on the bottom of the
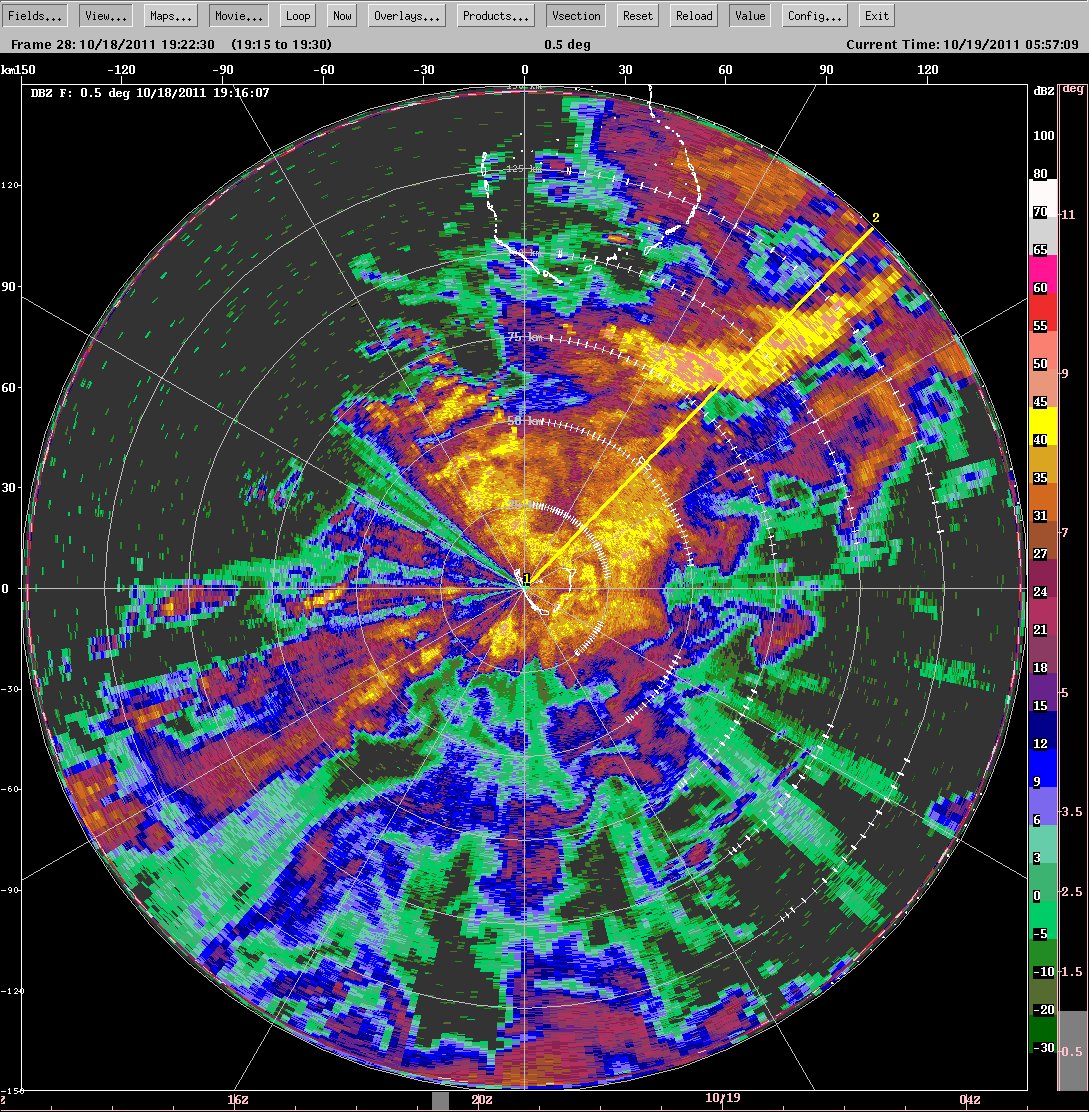
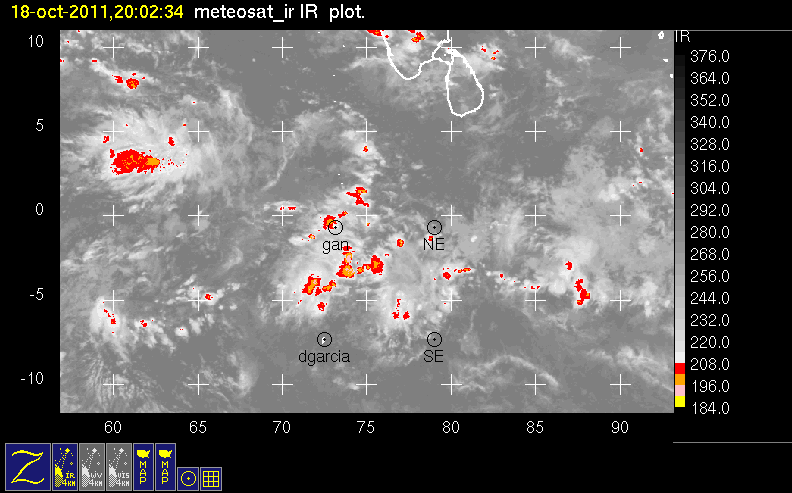
melting layer. At 2000 UTC, Gan was still located under
and surrounded by high cloud tops of the various
convective systems in the area (Figure
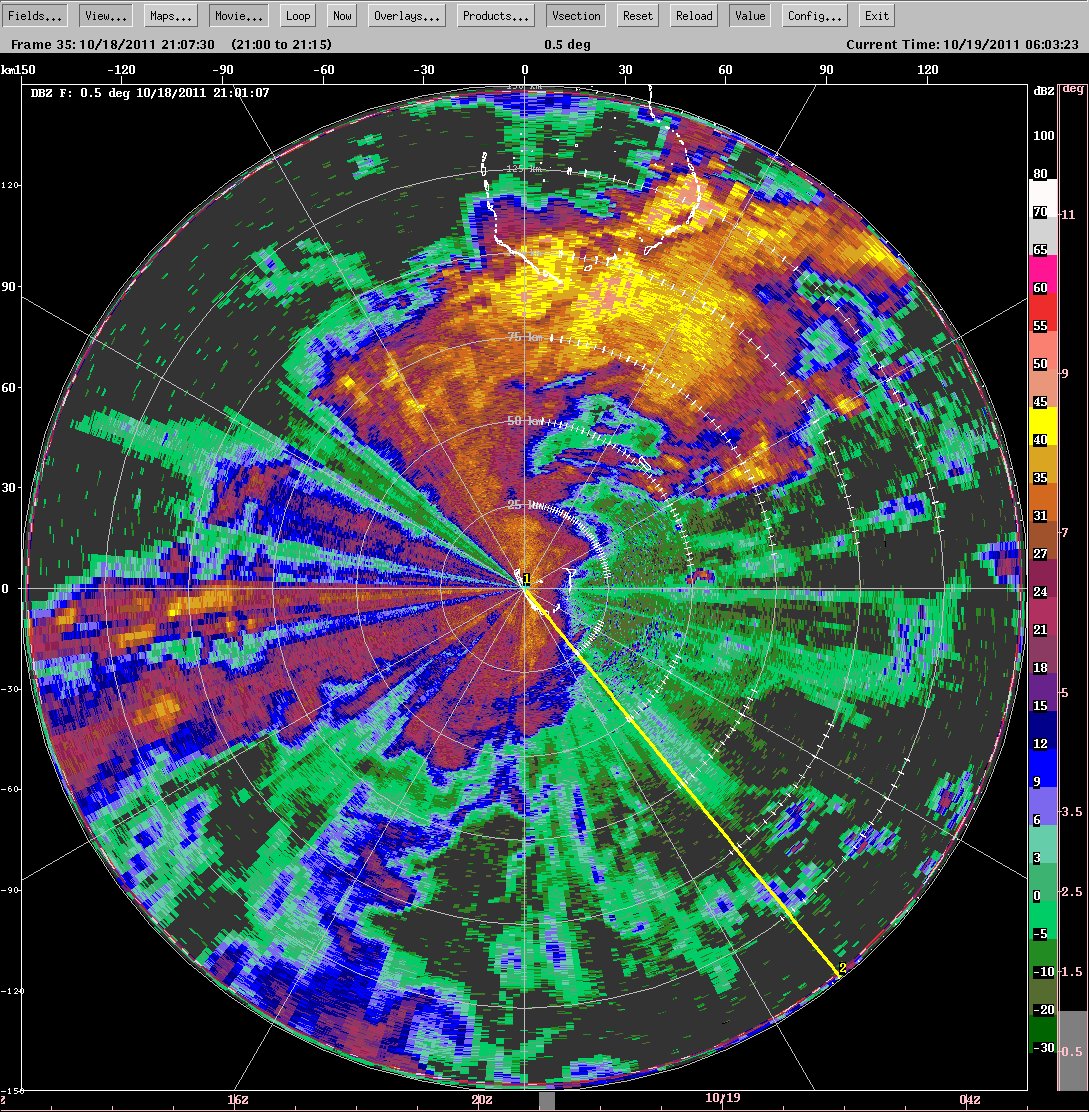
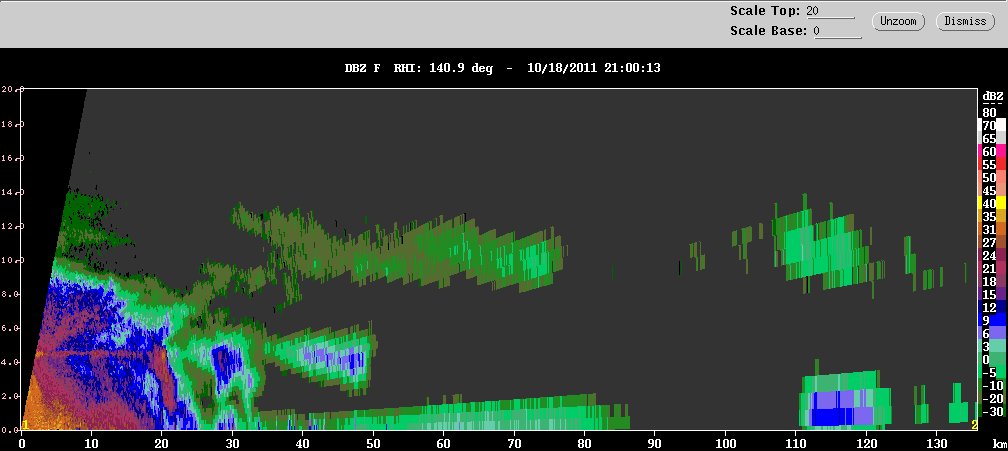
12). The S-PolKa radar data along the yellow line in
the PPI of
Figure 13 show and example of
the structure of the stratiform precipitation at the edge
of one of the widespread stratiform precipitation regions.
It shows a very thin but well defined bright band all the
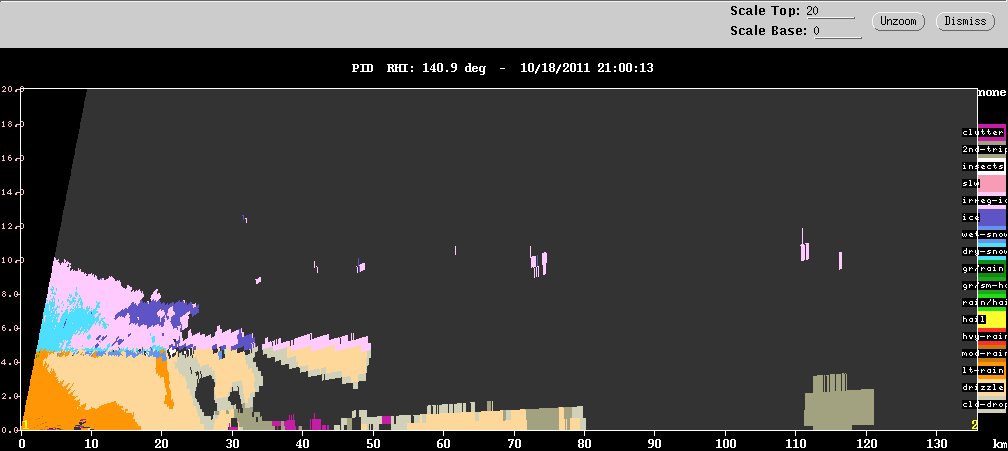
way to the edge of the echo. The particle identification
algorithms shows snow and and nonmelting aggregates but no
evidence of graupel or bigger ice particles.
Figure 1.
DOE Gan soundings for 18 October 2011.
Figure 2.
METEOSAT infrared image for 0530 UTC 18 October2011.
Figure 3.
Clockwise from upper left, S-PolKa PPI displays of
reflectivity for 0301, 0401, and 0501 UTC and radial
velocity for 0501 UTC 18 October 2011.
Figure 4.
Cloud photo looking SW from S-PolKa at 0422 UTC.
Figure 5.
METEOSAT infrared image for 0730 UTC 18 October 2011.
Figure
6. Cloud photo panorama looking (left-to-right)
from SE to S to SW from S-PolKa at 0726-0727 UTC 18
October 2011.
Figure 7.
S-PolKa reflectivity data for 0731 UTC 18 October 2011.
Vertical cross section in the lower panel is along the
yellow line in the PPI in the top panel.
Figure 8.
METEOSAT infrared images for 1330 and 1730 UTC 18
October 2011.
Figure 9.
S-PolKa reflectivity data for 1702 UTC 18 October 2011.
Vertical cross sections are taken along the yellow line
in the PPI in the top panel. Vertical sections in
descending order are for reflectivity, polarimetrically
derived hydrometeor type, and radial velocity.
Figure
10. S-PolKa reflectivity data for 1802-1809 UTC 18
October 2011. Vertical cross sections are taken along
the yellow line in the PPI in the top panel. Vertical
sections in descending order are for reflectivity,
polarimetrically derived hydrometeor type, and radial
velocity.
Figure
11. S-PolKa reflectivity PPI for 1917 UTC 18
October 2011 is shown in the top panel. Vertical cross
sections along the yellow line in the PPI are shown for
1947 UTC in the second and third panels. The cross
sections show reflectivity (middle panel) and
polarimetrically derived hydrometeor type (lower panel).
Figure
12. METEOSAT infrared image for 2000 UTC 18
October 2011.
Figure
13. S-PolKa reflectivity data for 2101 UTC 18
October 2011. Vertical cross sections are taken along
the yellow line in the PPI in the top panel. Vertical
sections in descending order are for reflectivity and
polarimetrically derived hydrometeor type.