Producing a 2D Scalar Plot
This file discusses the procedures for creating scalar plots in two dimensions.

Procedures:
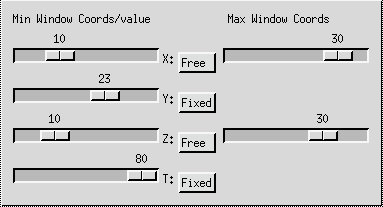
- It is first necessary to input a data FILE. This activates the Window/Slicer Widget (depicted below).
- Then, select a FIELD.
- At the Window/Slicer Widget, "fix" or "average" all coordinates except two. These two variables will become the ordinate and abscissa in your 2D plot. Adjust the range and domain of the plot using the slider bars of the free coordinates (see WINDOW).

Window/Slicer Widget
NOTE: The number of variables that you allow to vary determines the number of dimensions contained in the plot. For example, if only one coordinate is "free", then IVE will create a one-dimensional plot. If you "fix" or "average" all coordinates, then a Value Info Window is activated, displaying the value of the field at the fixed point you have specified.
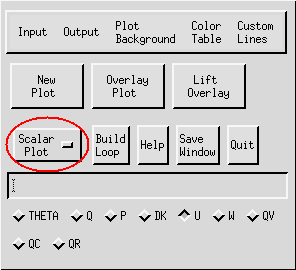
- Make sure that "Scalar Plot" is displayed in the IVE Main Window (see TYPE).

IVE Main Window
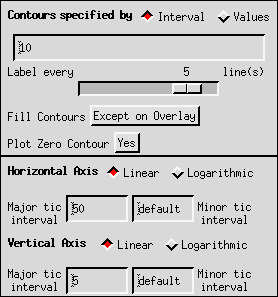
- Next, from the Properties Window (pictured below), choose a fill
type by clicking on the "Fill Contours" box. Several options are
available:
- Never: Scalar plots will be contoured (see Custom Lines)
- Except on Overlay: All 2D plots will be color-filled except overlay plots

Properties Window
- Always: All 2D plots and overlays will be color-filled
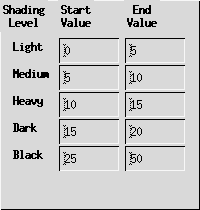
- With Stipple: All plots are filled with grayscale stipple (See Color Fill). When this option is selected,
the Shading Widget is activated, allowing the user to specify a value
range for each grayscale shade.

Shading Widget
The properties window also controls contour spacing, contour labeling, axis scales, and tic intervals. Contour spacing is specified by interval or by value. Selecting "Interval" spaces the contours by the amount that you enter in the data entry box provided. If "0" or "d" is entered, IVE automatically computes an interval for your plot. On the other hand, if you select "Values" it is necessary to input the value of each contour in the data entry box.
Both linear and logarithmic axis scales are available in IVE and can be selected by clicking on the appropriate diamond-shaped button. Major and minor axis tic intervals can be specified by clicking on the apropriate boxes and inputting the desired values.
- Finally, when all parameters have been set, click on "New Plot" in the IVE Main Window to display the plot, or "Overlay Plot" to overlay an existing plot (see PLOT and OVERLAY PLOT).
Example:
- A sample 2D, scalar, color-fill plot is shown below:

back to index


