General Setup
This document describes the general widget and icon interface of KwajZebra.
Main Windows
- Big
windows display horizontal cross-sections and overlays (see Fig. 1) using
an equidistant cylindrical mapping. The height of the horizontal cross-section
is indicated at the bottom-right hand corner of the window, and the position
of the vertical cross-sections is indicated by the red line drawn from near
the center of the range rings toward the southeast.
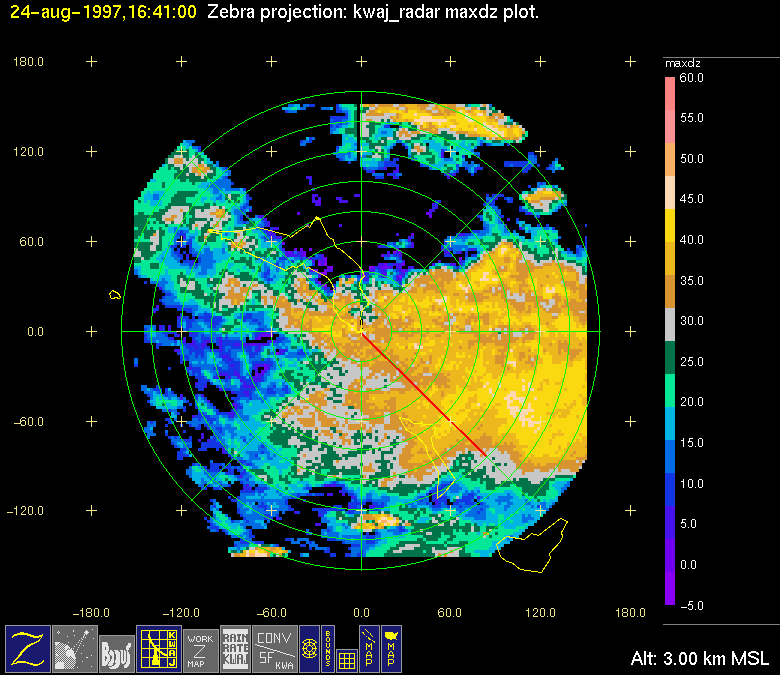
Fig. 1: The Big window depicting a sample horizontal cross-section through the reflectivity field at an altitude of 3.0 km MSL.
- Xsect
and xsectb are used to display and overlay vertical cross-sections
through the three-dimensional fields. Since multiple overlays can get somewhat
noisy and hard to read, two windows are provided for vertical cross-sections
(see Fig. 2).
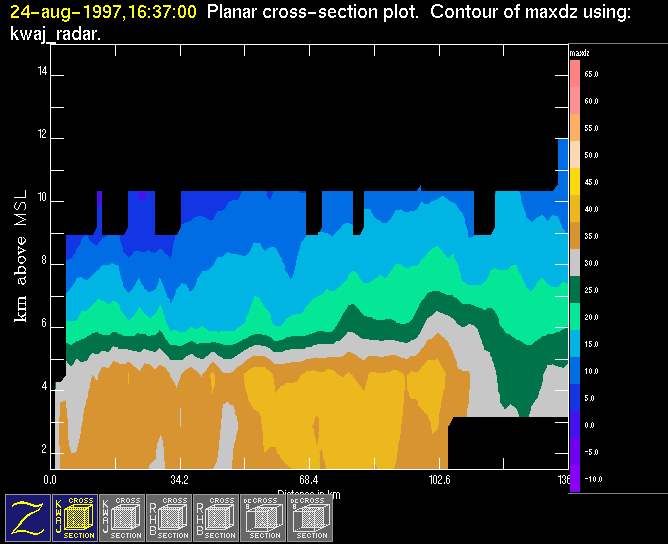
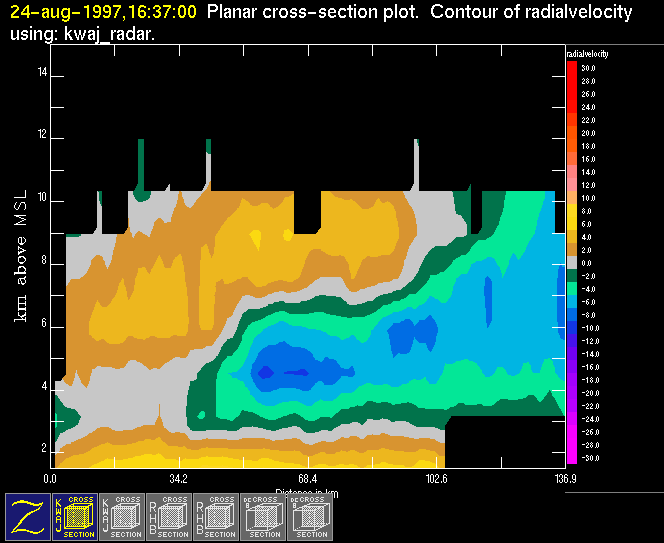
Fig. 2: a) The xsect window containing a vertical cross-section through the reflectivity field. b) The xsectb window containing a vertical cross-section through the radial velocity field. The position of the cross-sections is indicated by the red line in Fig. 1.
An abbreviated description of the currently enabled data directories is written at the top of each of the three main windows. For example, in Fig. 1, we see that the kwaj_radar directory (containing the radar data file) is currently enabled. Also, at the top left-hand corner of each window, a date and time are printed. The date and time indicate a reference time from which Zebra searches backwards through the enabled directories for available files. This time and date DO NOT represent the exact time and date of the data fields that are being displayed. NOTE: Zebra is in history mode if the font color of the date and time is yellow; Otherwise, Zebra is in real-time mode (see Keeping Track of the Time Mode).
The "Z" icon at the bottom-left hand corner of each window controls the global parameters for that particular window. By clicking on the window with the left mouse button, the "Global Options" menu is activated (see Fig. 3). Not all of these menu items apply to the xsect windows. "Enlarge Window", "Popup Overlay Times") apply to both xsect and big. The other items in this menu only apply to big. These options allow you to zoom back out to the global domain ("Scale back to big picture"), change the global domain displayable by big ("Adjust Global Limits"), and activate the Position widget which indicates the coordinates of any pixel in big specified by the left mouse button. By clicking on the "Z" icon with the right mouse button, one can specify the color and font size of the plot annotation. (NOTE: Submenus are indicated by a right-pointing arrow. To activate them, simply highlight the item that is indicated by an arrow, then move the mouse to the right).
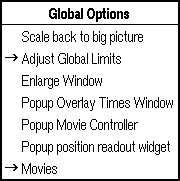
Fig. 3: The "Global Options" menu.
The other large icons at the bottom of the main window each represent a directory containing any number of data files. If that directory is currently enabled, the icon will appear blue and yellow, and if the directory is disabled, the icon will appear gray and white. The data file that is displayed from each enabled directory is the most recent one found in the directory before the reference time (shown in the top left corner of the window). IMPORTANT: If the time of this most recent file in the directory is more than 30 minutes before the reference time, the corresponding icon is highlighted in red to alert the user.
In the xsect windows, the icons labeled "cross section" all represent a single directory where radar data are stored (in this case "kwaj_radar"). For a detailed description of buttons in the big window, refer to the Button Appendix. The icon depicting a radar dish represents the radar directory ("kwaj_radar"), and the icon depicting a satellite over the earth represents a group of directories containing satellite data.
By clicking on any of these large icons (in either the xsect or big directory) with the left mouse button, the "Overlay Operations" menu is activated (Fig. 4). The first item on this menu allows you to adjust your contour intervals using the submenu "Adjust Limits" (see Plotting Functions). The submenu allows the user to specify the contour intervals of the current displayed field with "Center/Step" and to adjust highlights with "Highlight/Range".
The other menu
items in the "Overlay Operations" menu control the positioning of the icon
you selected. The positioning of the enabled icons relative to the others
in a particular window will determine where they fall in the overlay stack
(except for the "Z" icon, whose position is fixed). The enabled icon that
is farthest to the right (left) will be displayed as the top (bottom) overlay.
To move a given icon to the top of the overlay stack, select "Raise to top"
from the "Overlay Operations" menu. To move the icon to the bottom of the
stack, select "Move to bottom." To disable or reenable a directory, select
"Disable/reenable". Finally, to remove the icon from the window, select "Remove."
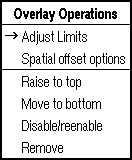
Fig. 4: The Overlay Operations Menu (activated by the left mouse button).
By clicking on
any of the large icons with the middle mouse button, another menu is activated
(see Fig. 5). The top of this menu displays the available fields contained
in the files in that directory (this portion of the menu is specific to each
icon). The field that it currently selected is indicated by an asterisk. The
middle portion of the menu displays possible color tables that can be used
to display the data field (the current color table is indicated by a second
asterisk). The bottom portion of the menu specifies the type of contours used
(see Plotting Functions).

Fig. 5: A sample menu activated by the middle mouse button.
By clicking on
any of the large icons with the right mouse button, a table is activated,
called "Data Available" menu (see Fig. 6). At the top and left of the table,
the current time mode is indicated (in this case, "Real time mode"). Below
this line, the table displays the name of the directory in the left column
(in this case "nex_cam") and the most recent data files that are available
in that directory in the right column.
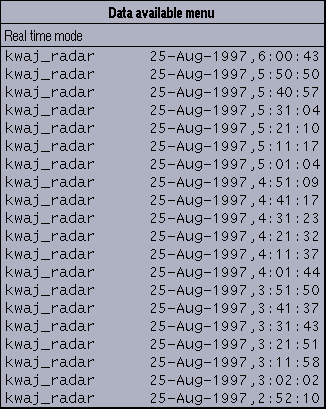
Fig. 6: The Data Available Menu (activated by the right mouse button).
The smaller icons in big represent (from left to right in Fig. 1): radar range rings, the line segment representing the location of the vertical cross-sections ("BOUNDS"), grid outlines, radar range rings, and map outlines ("MAP"). By clicking on the appropriate icon with any of these icons with the middle, or right mouse buttons, specific menus are activated which allow the user to alter the properties of these overlays.
Other Windows
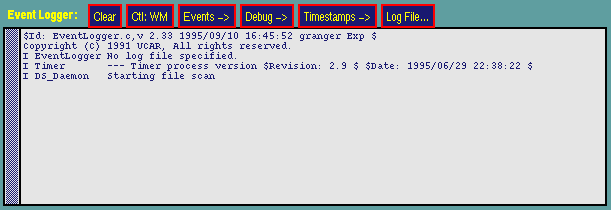
Fig. 7: The "Event Logger" window.
Finally, the "Icon Bar" widget (Fig. 8) is what controls the current Zebra session. Clicking on the "Z" icon activates the "Zeb Control Options" menu, which is subdivided into four sections. The first section allows the user to select a given display setup (in this case, only one is available: "Camano cross-sections"). The second and third sections allow the user to activate one of six widgets that perform specific operations. The two that are of importance to casual Zebra users are the "Position Entry" widget (see above) and the "Time" Widget (see Keeping Track of the Time Mode). By selecting "Shut down Zeb system", which is the last section of the "Zeb Control Options" menu, all Zebra processes are shut down.
Fig. 8: The "Icon Bar" widget.
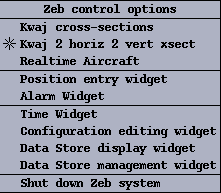
Fig. 9: The "Zeb Control Options" menu.
The "Print" icon
of the "Icon Bar" window allows the user to print a screen dump of a Zebra
window. Clicking on the "Help" icon opens a menu containing various help documents.
Upon selecting a document, a web browser is opened and the selected document
is loaded. The other icons in the "Icon Bar" allow the user to add overlays
(icons) to big and the xsect windows. For example, by clicking
on one of these icons and selecting an item on the corresponding menu, the
user selects a data directory or overlay. Once this data directory or overlay
is selected, the user must move the mouse pointer to one of the main windows
and then click with any mouse button. This will add the new icon to the top
of the overlay stack in that window (i.e. a new icon corresponding to the
selected overlay will appear as the rightmost icon in the selected window).
KwajZebra { General | Time | Fields | Functions | Movies }
Scientific contact:
Professor Sandra Yuter, Project
Science Coordinator