 |
| Marta I. Krynytzky | |
| mkrynytz@u.washington.edu |
|
| arctic climate project | |
| motivations | |
| about AOGCMs | |
| what is the IPCC | |
| methods | |
| results | |
| summary | |
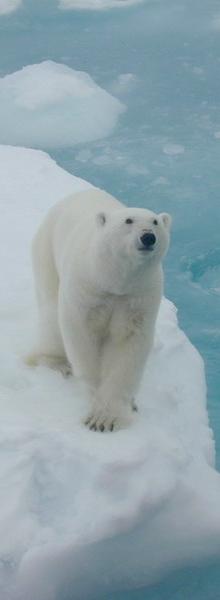
photo by Cathy Crane, NOAA Arctic Research Office.
|
all contents copyright Marta Krynytzky 2005 unless otherwise noted
|
The Effects of Global Warming in High Latitudes:
Reduction of Sea Ice
Figure 2: Changes in Sea Ice Concentration from an Average of 1980-1999 to an Average of 2040-2059
|
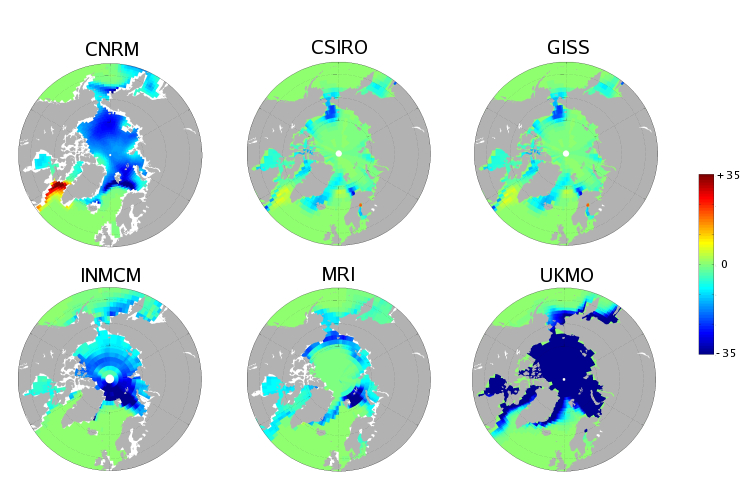
Fig. 2: The difference in sea ice concentration between two twenty year averages: 2040-2059 and 1980-1999. View is looking down at the North Pole. Color scale is from -35 to 35 percent. Grey areas are land masses. Averages reflect year-round calculations; changes are even greater in summer months, when melting occurs.
