 |
| Marta I. Krynytzky | |
| mkrynytz@u.washington.edu |
|
| arctic climate project | |
| motivations | |
| about AOGCMs | |
| what is the IPCC | |
| methods | |
| results | |
| summary | |
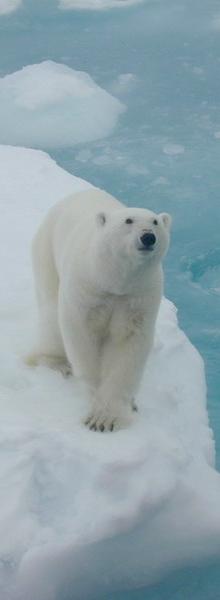
photo by Cathy Crane, NOAA Arctic Research Office.
|
all contents copyright Marta Krynytzky 2005 unless otherwise noted
|
The Effects of Global Warming in High Latitudes:
Reduction of Sea Ice
Figure 4: Changes in Surface Air Temperature from an Average of 1980-1999 to an Average of 2040-2059
|
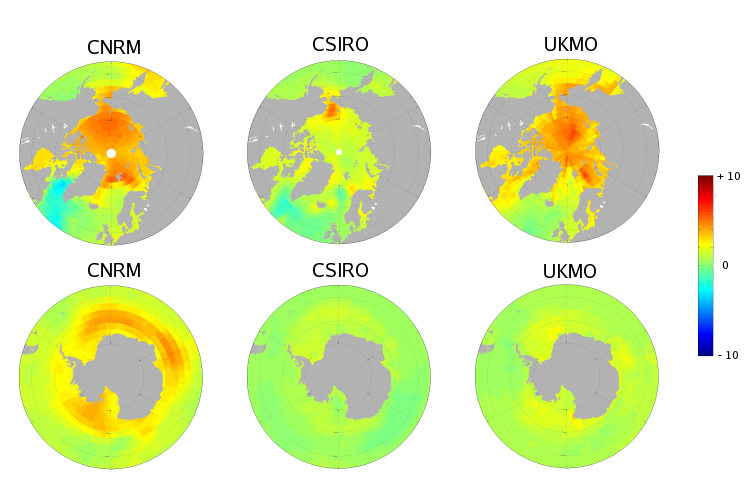
Fig. 4: Arctic (top) and Antarctic (bottom) changes in the surface air temperature from an average of 2040-2059 to an average of 1980-1999. Color scale is from -10 to 10 degrees Celsius. Grey indicates land masses. Models predict greater warming in the Arctic compared to the Arctic due to the large thermal inertia of the Southern Ocean and the Antarctic Ice Sheet.
