Week1: January 3 January 5
Week2: January 10, January 12
Week3: January 17, January 19
Week 5: January 31, February 2
Week 6: February 7, February 9, February 10
Week 7: Lee Waves and Mountain Waves, February 14, Februrary 16
Week 8: February 21, February 23, Downslope Winds
Week 9: February 28, March 2
Week 10: March 7, March 9
Preliminaries: Static Instability
- 3.1 Static Instability, pp. 41-43
- 2.6 Thermodynamic diagrams, pp. 32-34
- 3.1.1 Vertical velocity of an updraft, p. 43
- 3.1.2 Limitations of parcel theory, pp. 44-47
- Fig. 3.1 Warm bubble comparisions
- Fig. 2.7 Pressure perturbations around a rising bubble
- Fig. 3.2 Skew-T illustrating entrainment
- Fig. 3.3 Potential instability
- 3.1.3 Potential Instability, pp. 47-48
Chpt 7: Convective Initiation
- 7.1 Requisites for initiating convection, pp. 183-189
- 7.2 Mesoscale complexities of convective initiation
Chpt 5: Air Mass Boundaries
- 5.1.5 Kinemnatics of frontogenesis
- 5.2 Drylines
- 5.3 Outflow Boundaries
Chpt 8: Organization of Isolated Convection
- 8.1 Role of vertical wind shear
- Fig. 8.1 0-6km vector wind difference
- Fig. 8.3 Comparision of simulated no-shear and strong-shear storms
- Fig. 8.4 Comparison of radar reflectivity for weak- and strong-shear storms
- Fig. 8.5 Storm morphology as a function of wind shear
- 8.2 Single-cell convection
- Fig. 8.6 Photos of single cell storms
- Fig. 8.7 Radar reflectivity for disorganized t-storms
- Fig. 8.8 The life of a single cell
- 8.3 Multi-cell convection
- 8.4 Supercellular convection
- Storm structure
- Storm dynamics
Chpt 9: Mesoscale Convective Systems
- 9.1 General characteristics
- Fig. 9.1 radar reflectivity for a trailing stratiform squall line
- Fig. 9.6 IR satellite image of an MCC
- 9.2 Squall line structure
- Fig. 9.7 schematic for trailing stratiform type
- Fig. 9.8 front-to-rear storm-relative winds
- Fig. 9.9 mid-level rear-to-front flow in cases with strong rear inflow
- Fig. 9.11 Schematic of linear MCS archetypes
- Fig. 9.12 radar reflectivity for LS and PS types
- Fig. 9.13 Solid and 3D reflectivities at the gust font
- MAUL schematic Bryan and Fritsch (2000)
- 9.3 Squall line maintenance
- Fig. 9.17 Sample budget volume
- Fig. 9.14 Ilustration of vorticity balance-imbalance
- Fig. 9.18 Different vertical-vorticity fluxes
- Fig. 9.15 Example of updraft characteristics with different environmental shears
- Fig. 9.20 Climatologies of low-level shears in systems with severe straight-line winds
- The mesoscale circulation in squall lines (Pandya and Durran, 1996)
- 9.4 Rear inflow and bow echoes
- 9.5 MCCs
Chpt 10: Hazards Associated with Deep Moist Convection
- 10.1.1 Tornadoes
- Fig. 10.1 Utility of CAPE times Shear
- Fig. 10.2 Avrg annual number of days with environments favorable for tornadic SS
- 10.1.2 Tornado genesis
- Fig. 10.3 Schematic: generating or exploiting low-level vorticity
- Fig. 10.4 Clear slot
- Fig. 10.5 Outflow air entering updraft
- Fig. 10.7 Baroclinically generated vorticity in downdraft
- Fig. 10.8 Tilting and stretching of downdraft generated vorticity
- Fig. 10.6 Archng vortex lines in case study
- 10.1.3 Nonmesocyclonic tornadoes
- 10.1.4 Forecasting tornadoes
- 10.1.5 Tornado Structure and Dynamics
- SPC's "about tornadoes"
- 10.2 Nontornadic damaging straight-line winds
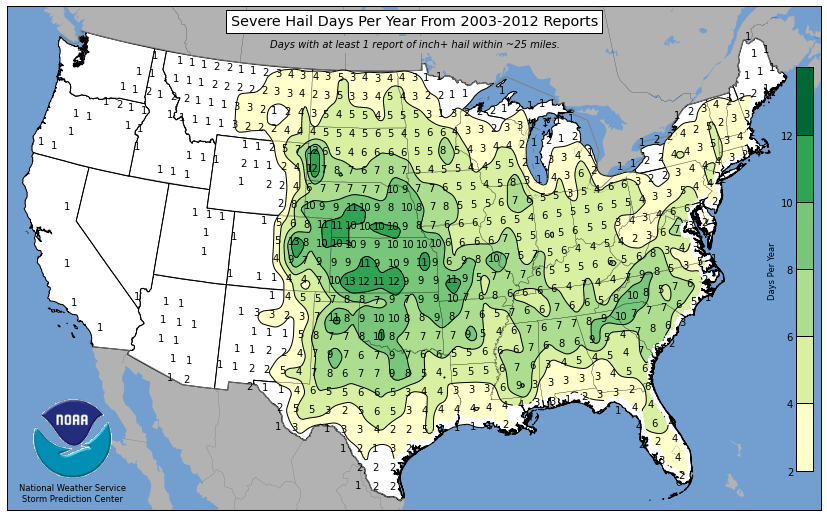
- 10.3 Hailstorms
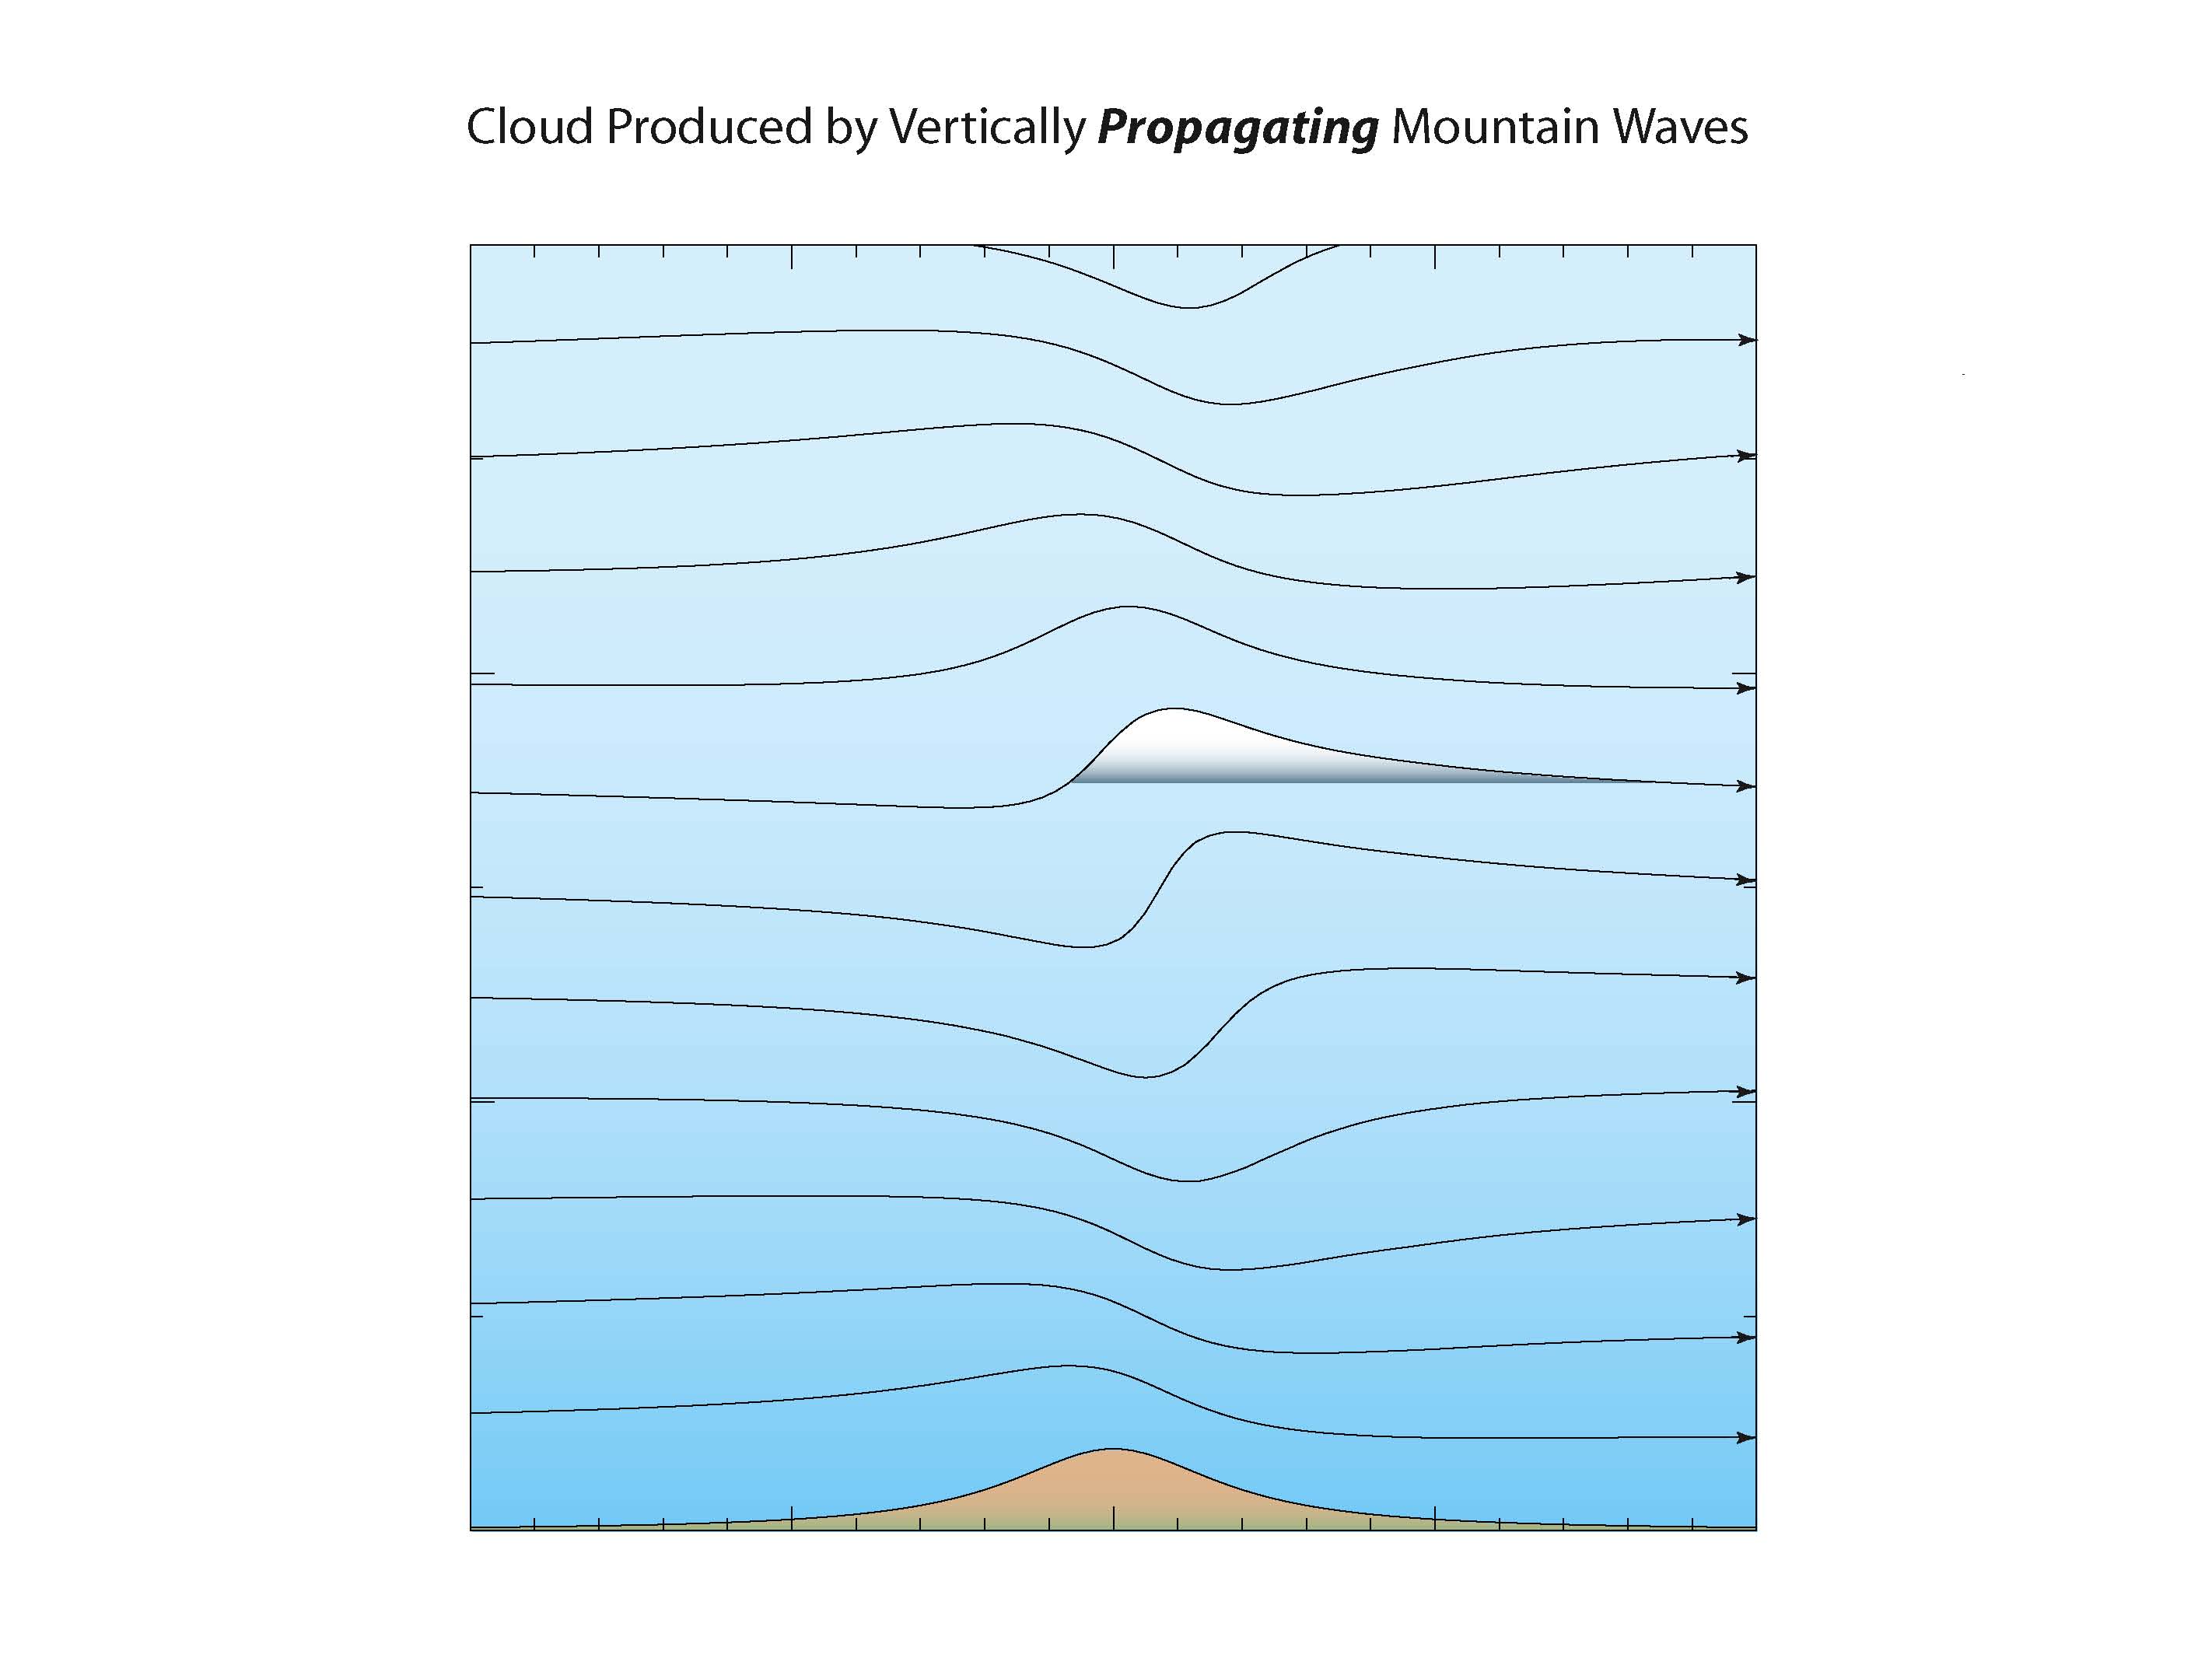
Chpt 12: Mountain Waves and Downslope Windstorms
Chpt 13: Blocking of the Wind by Terrain
- 13.1 Flow stagnation
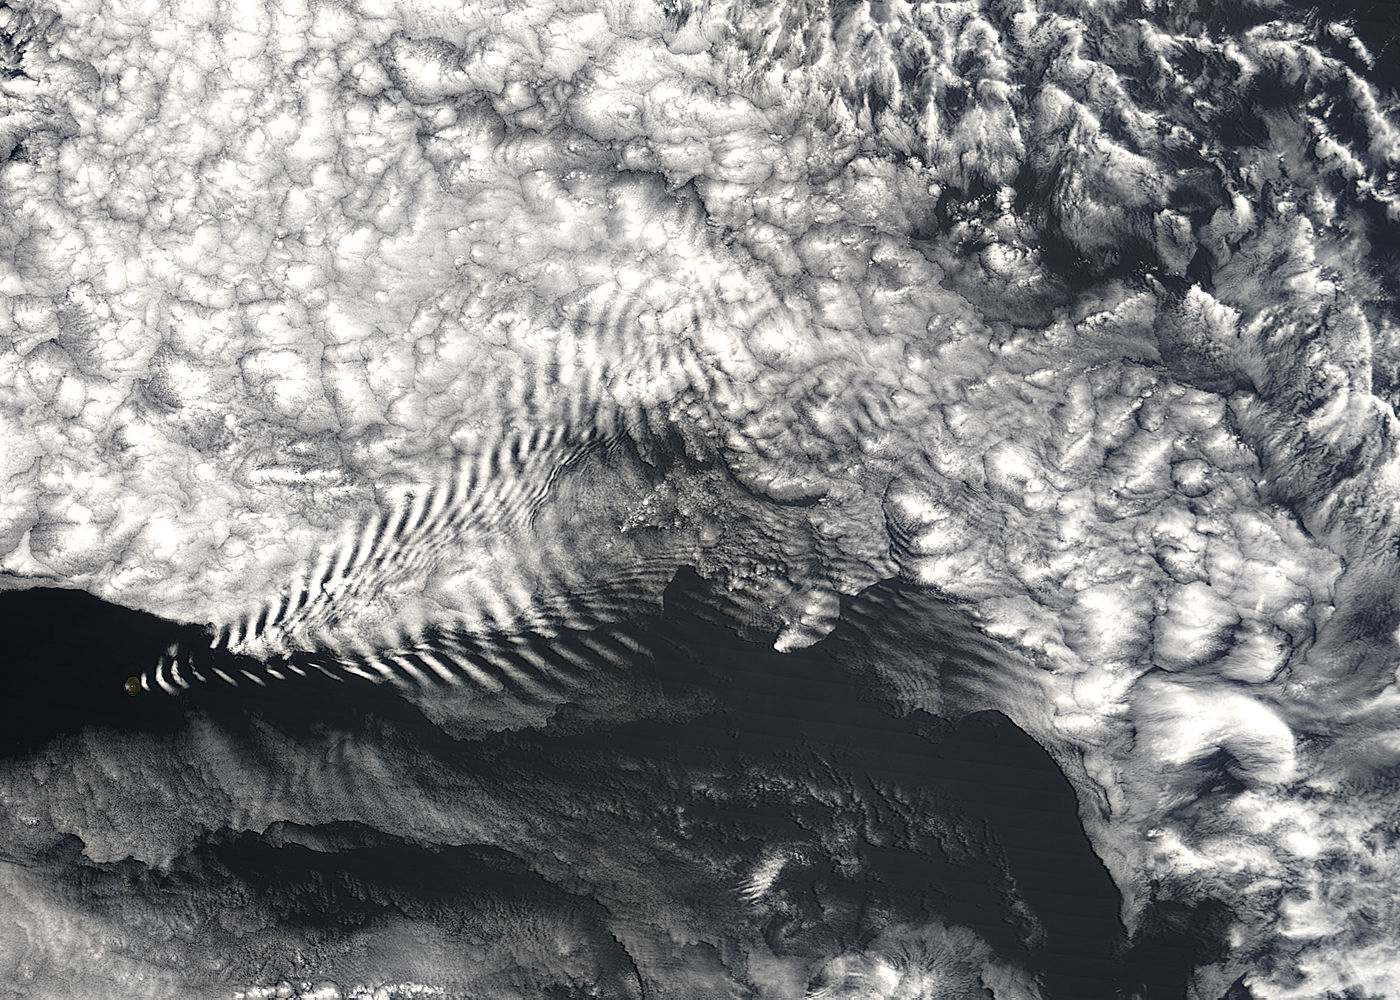
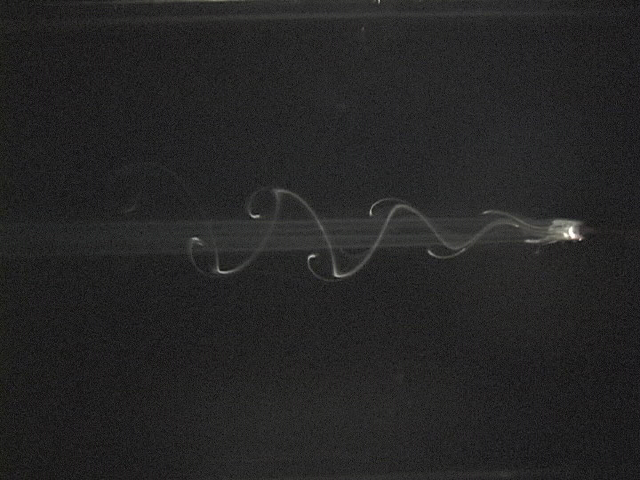
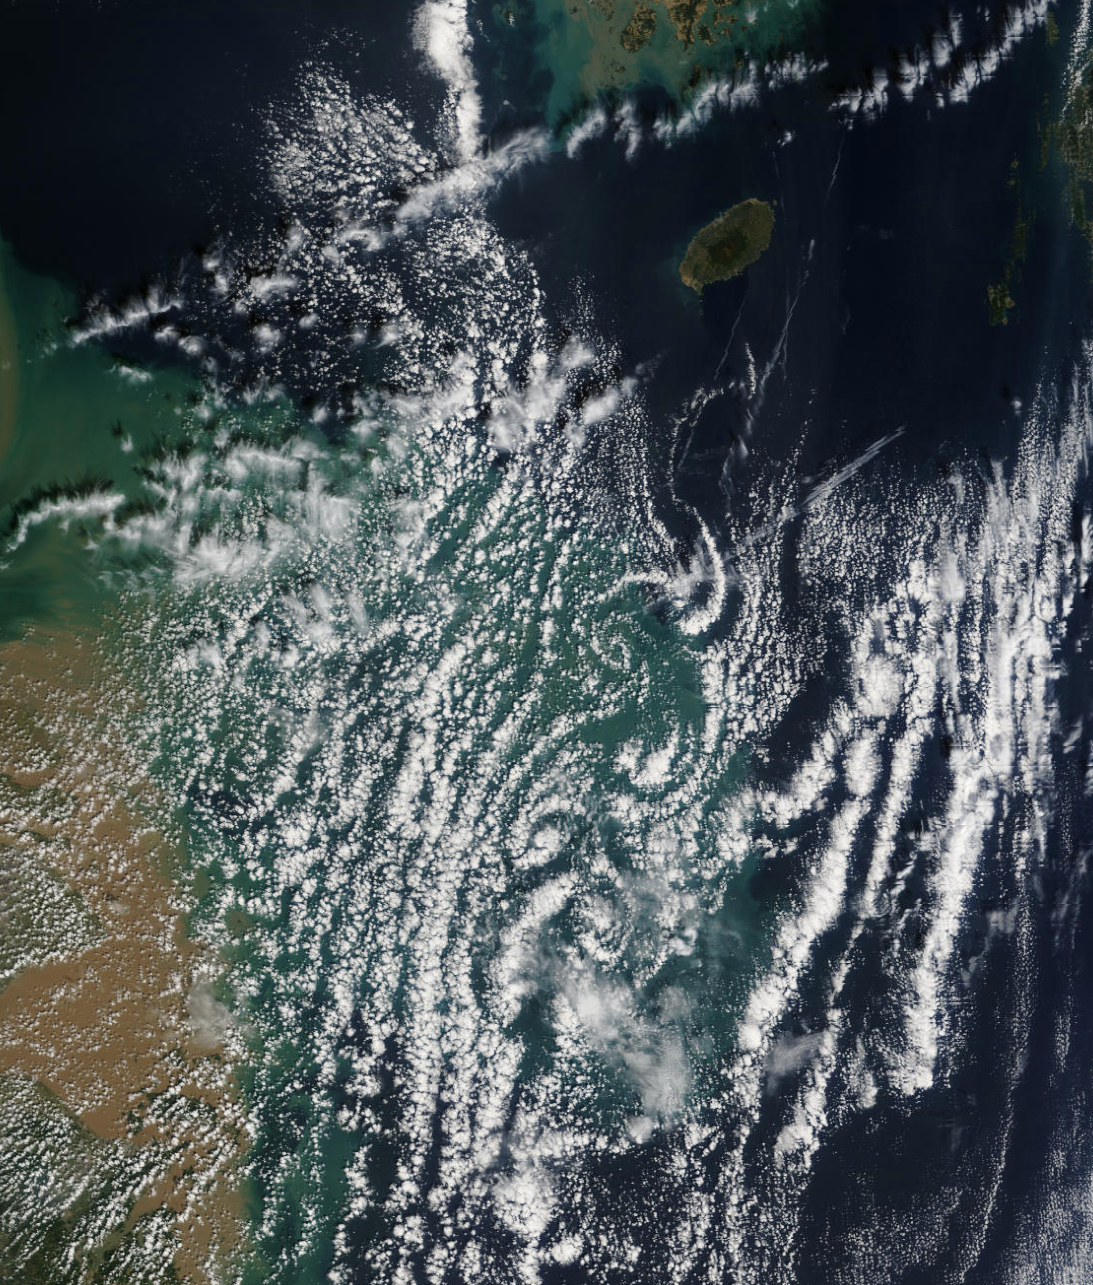
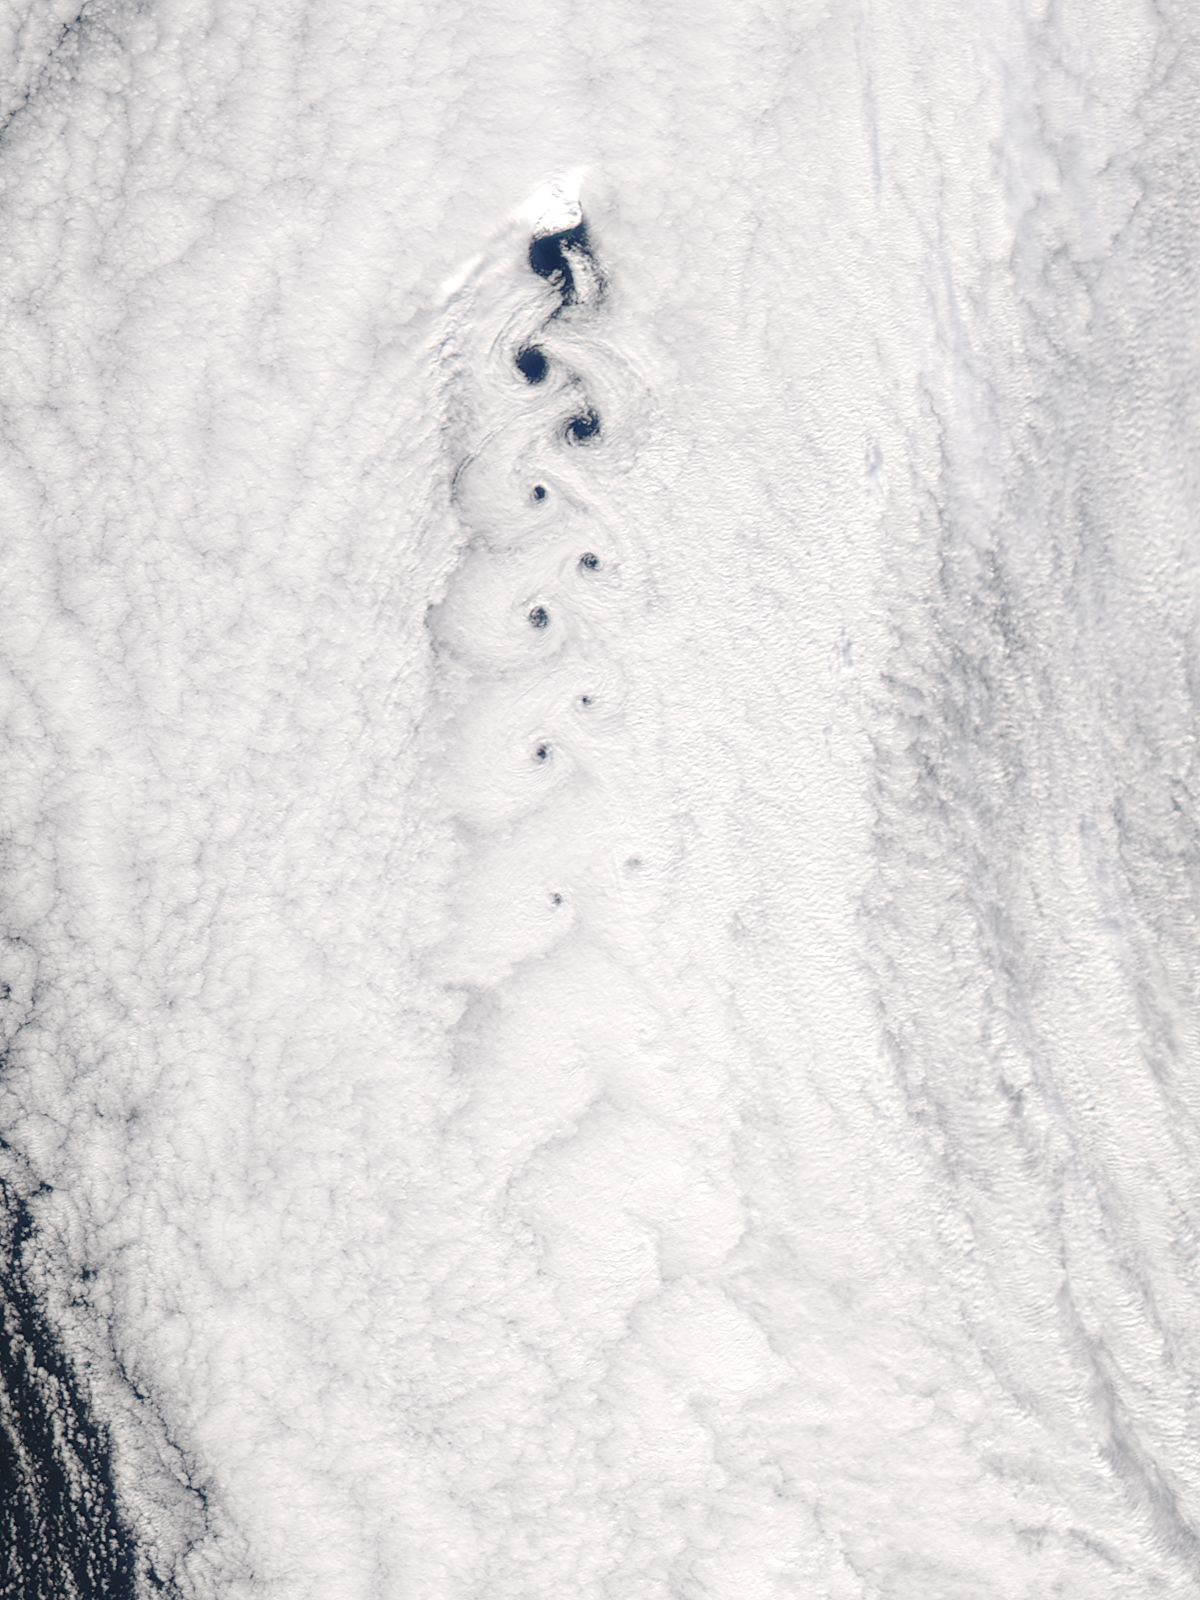
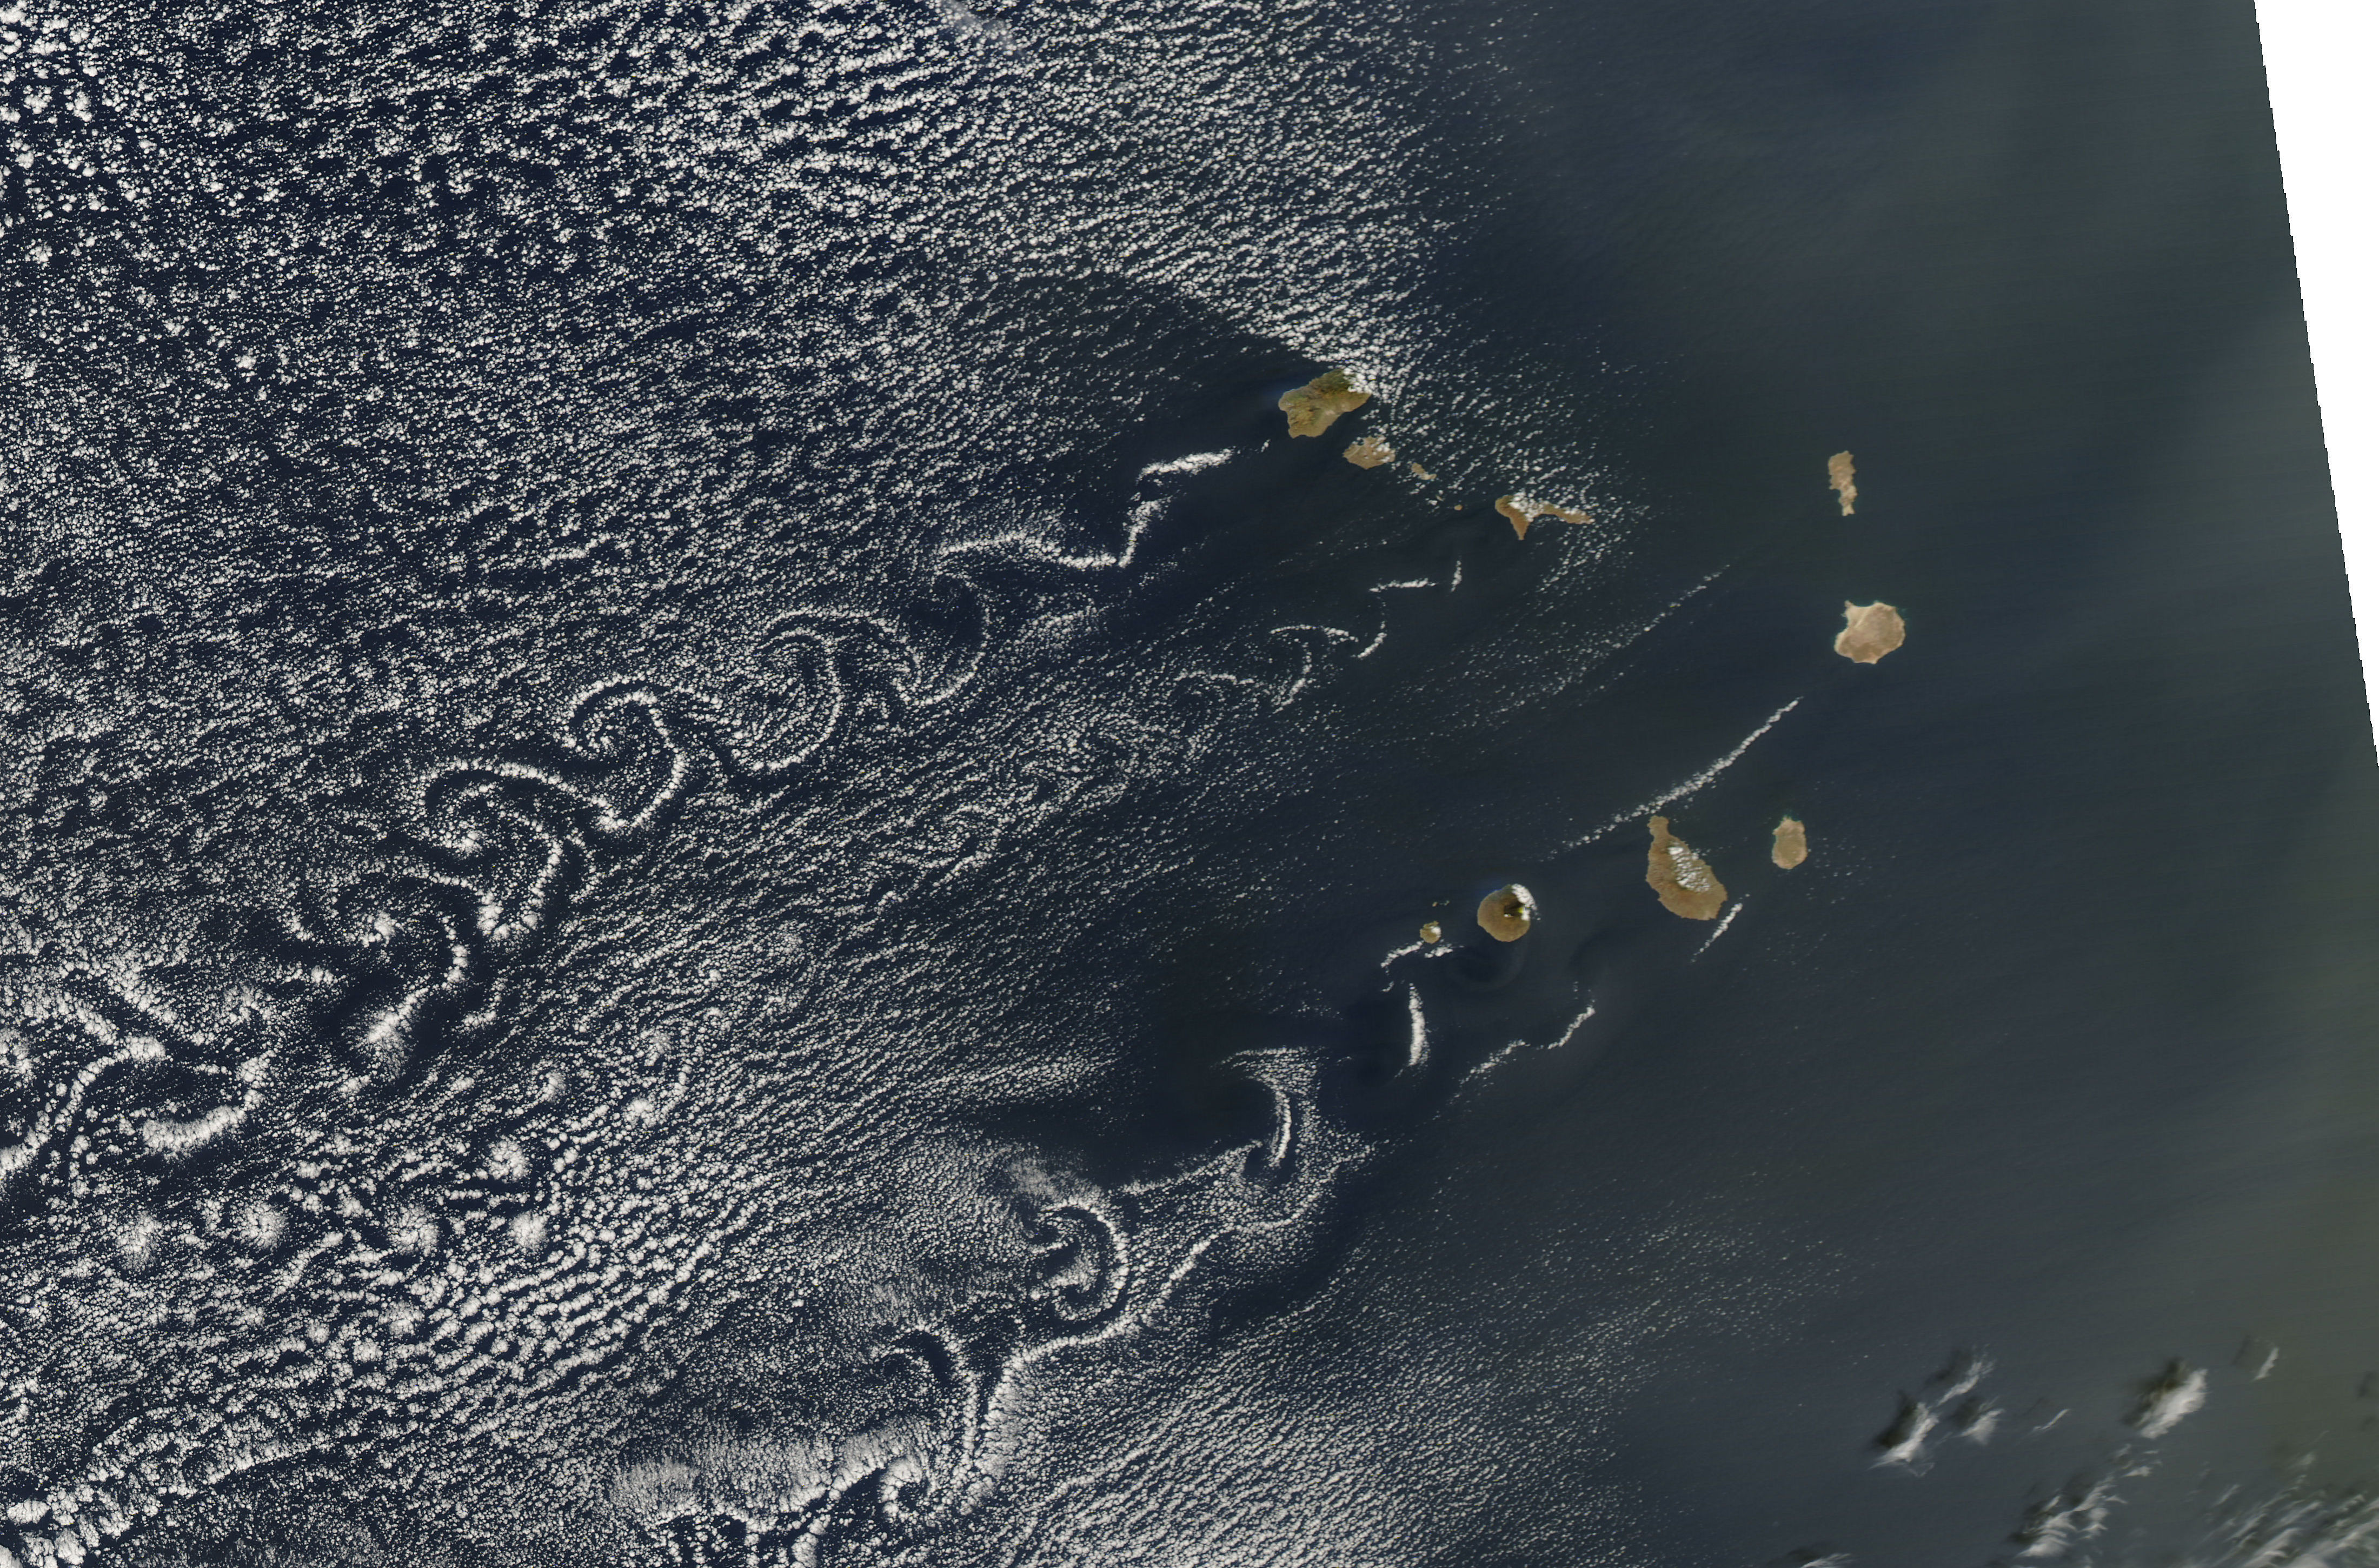
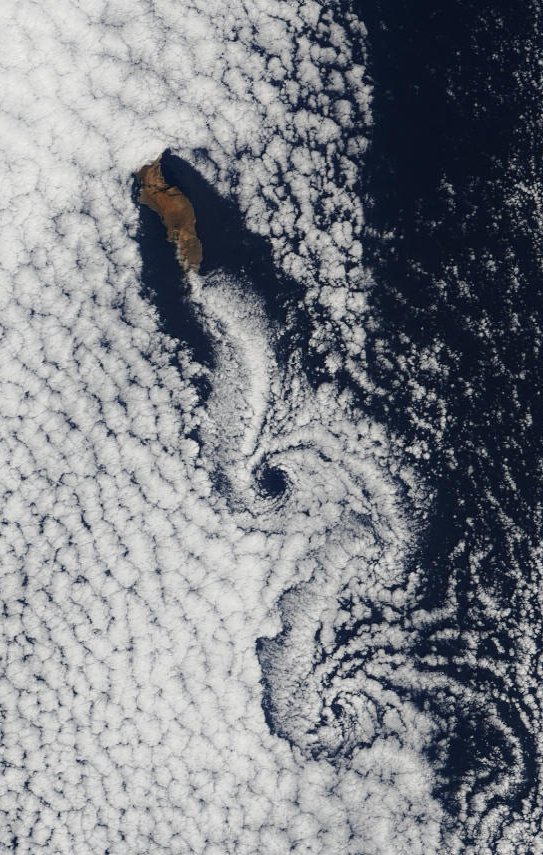
- 13.3 Lee vortices
- 13.4 Gap winds